Visualização de painéis
Saiba como criar uma visualização de painel, adicionar e organizar widgets e gerenciar autorizações e desempenho.
Acessar as perguntas frequentesAs visualizações de painel transformam qualquer base de dados em um centro de controle de fácil visualização. Em vez de alternar entre várias visualizações, você pode organizar widgets, como tabelas, quadros, calendários, gráficos e cronogramas, em um único layout.
As visualizações de painel estão disponíveis nos Planos Business e Enterprise.
Os painéis funcionam bem para:
Relatórios de status da equipe
Visões gerais de incidentes ou tickets
Resumos de vendas e funis de vendas
Desempenho de conteúdo ou campanha
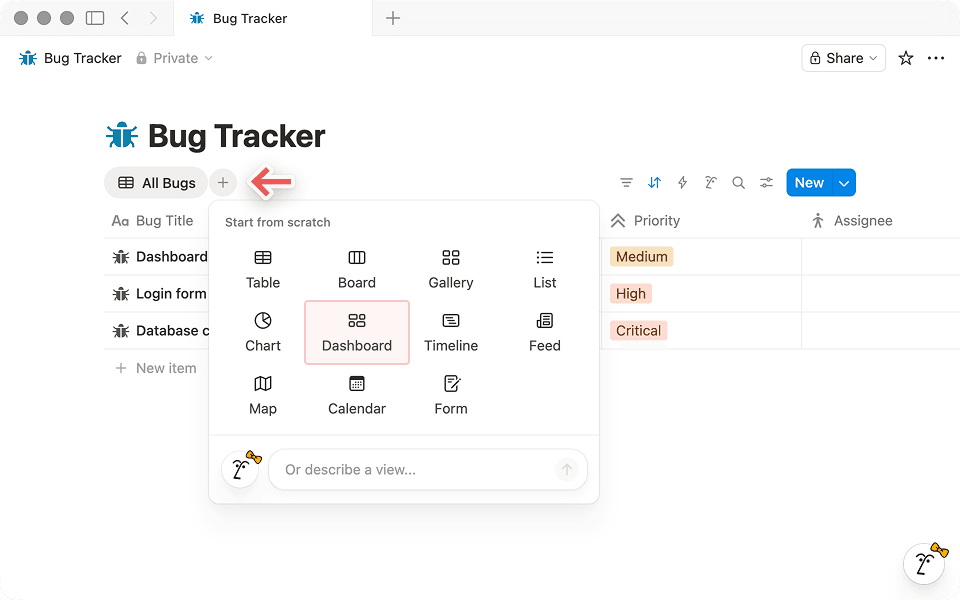
É possível adicionar uma visualização de painel a qualquer base de dados.
Abra uma base de dados (em página inteira ou in-line).
Selecione
+ Adicionar uma nova visualização.Selecione
Painel.
Você começará no modo de edição para poder começar a criar seu layout imediatamente.
Criar com um comando de barra
Você também pode criar uma visualização de painel com um comando de barra:
Em uma página, abra o menu de comandos ou digite
/painel.Selecione visualização de
painel.Dê um nome à visualização e comece a editar o layout.
Você pode criar um painel manualmente ou usar o Agente do Notion para gerar um primeiro rascunho.
Criar com o Agente do Notion
Você também pode usar o Agente do Notion para criar e aprimorar um painel. Isso é muito útil quando você quer um ponto de partida rápido ou não tem certeza de quais widgets incluir.
Por exemplo, você pode pedir:
“Crie um painel para a minha [@base de dados de tarefas] que me dê uma visão geral das principais métricas do trabalho.”
Depois que o agente criar um primeiro rascunho, mude para o modo de edição, onde você poderá reorganizar os widgets, ajustar a altura das linhas e ajustar as visualizações exibidas por cada widget.
O Agente do Notion também pode ajudar você a fazer iterações em um painel existente. Por exemplo, você pode solicitar a ele:
Adicionar novos widgets para acompanhar propriedades específicas
Reorganize o layout para destacar as métricas importantes
Crie visualizações que se concentrem em determinadas tarefas, proprietários ou status
Os widgets são os elementos fundamentais que compõem as visualizações de painel. Cada widget exibe uma visualização de base de dados proveniente de uma fonte de dados. Os painéis podem combinar widgets de uma ou várias bases de dados.
Adicionar widgets
Para entrar no modo de
edição, selecione“Editar”no cabeçalho da base de dados.Clique no ícone
+em uma linha ou na parte inferior da tabela para adicionar um novo widget.Escolha a visualização de base de dados que o widget deve exibir:
Selecione uma visualização existente na base de dados ou
Crie uma visualização para este painel.
Se você estiver planejando um layout maior, lembre-se de que os painéis aceitam até 4 widgets por linha e 12 widgets no total.
Gerenciar widgets
Para abrir o menu de ações de um widget, clique com o botão direito do mouse no widget (ou clique no título dele).
Duplicar um widget: selecione
Duplicarpara criar uma cópia com as mesmas configurações de visualização e o mesmo layout.Excluir um widget: selecione
Excluirpara remover o widget do painel.
Organizar widgets
No modo de edição, você pode organizar seu layout movendo widgets para linhas diferentes, reordenando-os dentro de uma linha ou removendo widgets desnecessários.
Arraste os widgets para movê-los ao lugar desejado.
Se você não vir a opção de mover um widget, abra o menu do widget clicando com o botão direito do mouse no widget ou no título dele e, em seguida, use as opções disponíveis para mover ou reordenar.
Ajustar larguras de widgets e alturas de linhas
Larguras:
No modo de
edição, passe o cursor entre dois widgets.Arraste a alça para a esquerda e para a direita para redimensionar.
Alturas:
No modo de
edição, passe o cursor sobre a borda entre duas linhas.Arraste o divisor para cima ou para baixo.
Alterar o que um widget exibe
Cada widget exibe uma visualização específica de uma base de dados. Nas opções de visualização do widget, você pode ajustar configurações como:
Filtros (por exemplo, apenas tarefas “Abertas”)
Ordenações (por exemplo, mais recentes primeiro)
Grupos (por exemplo, por status ou responsável)
Tipo de visualização (por exemplo, tabela, quadro ou gráfico)
Consulte o nosso artigo sobre visualizações, filtros, classificações e grupos para saber como refinar e estruturar seus dados.
Como salvar filtros e classificações em painéis
Por padrão, os filtros e as classificações aplicados no modo de visualização não serão salvos no painel. Eles são armazenados localmente, a menos que você selecione "Salvar para todos" e tenha permissões de edição.
Os filtros globais permitem que você aplique um filtro a vários widgets em um painel de uma só vez, mesmo que esses widgets obtenham dados de fontes diferentes.
Selecione o ícone de filtro no seu painel.
Selecione
Filtrar várias fontes.Selecione uma propriedade e defina seus critérios de filtro.
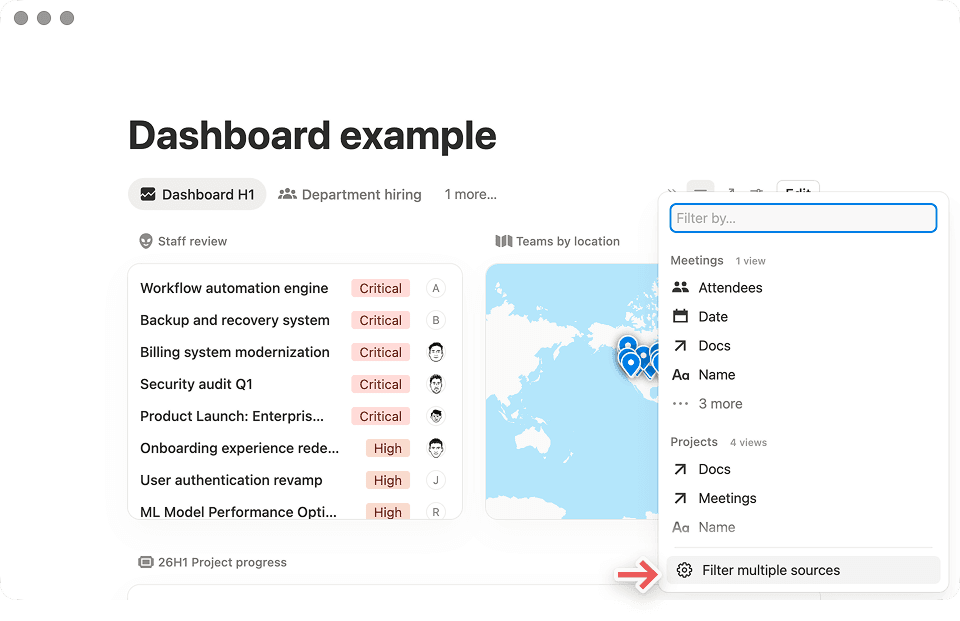
Como usar filtros globais em vários widgets
Os filtros globais funcionam de maneira diferente dos filtros no nível do widget:
Os filtros globais afetam apenas os widgets cujas visualizações subjacentes incluem a propriedade que você está filtrando.
Por exemplo, se você adicionar um filtro global para
Status, ele se aplicará apenas a widgets que incluam uma propriedade deStatus.
Você pode adicionar vários filtros globais ao mesmo painel, incluindo filtros para diferentes propriedades.
Você pode aplicar filtros globais a várias fontes, desde que os widgets tenham em comum as propriedades relevantes.
As visualizações de painel têm dois modos. Isso ajuda a manter os painéis estáveis para os visualizadores, ao mesmo tempo em que oferece aos editores um espaço dedicado para criar o layout.
Modo | Quando usar | O que você pode fazer |
|---|---|---|
Modo de visualização | Você está usando um painel. | • Abrir páginas a partir de widgets. |
Modo de edição | Você deseja criar ou atualizar o layout do painel. | • Adicionar, remover e reorganizar widgets. |
Cada widget exibe uma visualização específica de uma base de dados. Você pode ajustar o layout do widget ou a visualização que ele exibe.
Editar o layout do widget
No modo de edição, você pode:
Mover um widget para outra linha
Redimensionar a linha dele
Removê-lo do painel
Editar a visualização do banco de dados do widget
Nas opções de visualização do widget, você pode atualizar as configurações de visualização subjacentes (como filtros, classificações, grupos e tipo de visualização).
As edições feitas em uma visualização podem aparecer em outras páginas
As alterações feitas na visualização subjacente também podem aparecer em qualquer outro lugar em que essa visualização seja usada, dependendo das configurações do seu espaço de trabalho.
As visualizações de painel seguem as mesmas autorizações que a base de dados subjacente.
Se você tiver acesso de edição à base de dados, poderá:
Criar visualizações de painel
Editar o layout do painel
Configurar as visualizações usadas pelos widgets
Se você tiver apenas acesso de visualização à base de dados, poderá:
Abrir visualizações de painel no modo de visualização
Interagir com o conteúdo levando em conta suas permissões (por exemplo, abrir páginas)
É necessário acesso de edição à base de dados para alterar o layout do painel.
Os painéis podem ficar lentos se carregarem muitos dados de uma só vez. Para mantê-los rápidos e responsivos:
Concentre cada widget no que mais importa. Evite adicionar mais widgets do que o necessário.
Use filtros para limitar os dados que cada widget carrega. Por exemplo, filtre por “Esta semana” ou “Status não é concluído”.
Evite widgets de tabela grandes e sem filtros. Use gráficos ou visualizações agrupadas para mostrar resumos e, em seguida, clique para ver os detalhes.
Comece com insights de alto nível. Use os widgets como pontos de entrada para explorar os dados subjacentes quando necessário.
Evite sobrecarregar seu painel
Os painéis aceitam até 12 widgets no total (até 4 por linha). Para manter a agilidade, evite adicionar várias visualizações de painel à mesma página.
É possível criar uma página no estilo de painel usando visualizações de base de dados in-line organizadas em colunas. No entanto, use as visualizações de painel quando quiser um layout estável e replicável.
Se você precisar de texto enriquecido, imagens e várias bases de dados em uma única página de formato livre, use visualizações in-line em colunas. Se você quiser um layout consistente que possa reutilizar como uma visualização, use uma visualização de painel.
Use uma visualização de painel quando quiser:
Uma interface estável, semelhante a um aplicativo, que é mais difícil de danificar acidentalmente
Uma separação clara entre a edição do layout e o uso do painel no dia a dia
Um alinhamento mais organizado, no qual as linhas redimensionam juntas
Use visualizações de base de dados in-line em colunas quando quiser:
Um layout de página de formato mais livre, que combina bases de dados com texto enriquecido, imagens e textos explicativos
Flexibilidade para fazer experimentos rapidamente, sem se comprometer com uma visualização reutilizável
Layouts altamente personalizados que mudam de página para página
Veja alguns padrões que você pode usar como ponto de partida.
1) Central de status da equipe
Um layout simples para as atualizações semanais da equipe, que reúne o progresso, o trabalho em andamento e os obstáculos em um só lugar.
Linha 1 :
Gráfico do funil por etapa (ou receita recorrente anual total por segmento)
Linha 2 :
Tabela de projetos de maior prioridade
Tabela de riscos ou itens bloqueados
Linha 3:
Cronograma dos principais marcos
2) Visão geral de incidentes ou tíquetes
Um layout focado na triagem para monitorar o volume, a urgência e a responsabilidade, para que nada passe despercebido.
Linha 1 :
Gráfico de tickets abertos, organizados por gravidade
Gráfico de tickets, organizados por canal
Linha 2 :
Tabela de tickets não atribuídos
Tabela de tickets que violam o SLA
Linha 3:
Linha do tempo de tickets, organizados por data de criação
3) Relatórios executivos
Um layout de alto nível para que a liderança possa analisar rapidamente as principais métricas, as principais prioridades e o cronograma dos marcos.
Linha 1 :
Gráfico do funil por etapa (ou receita recorrente anual total por segmento)
Linha 2 :
Tabela de projetos de maior prioridade
Tabela de riscos ou itens bloqueados
Linha 3:
Cronograma dos principais marcos
Perguntas frequentes
Why is my dashboard loading slowly?
Why is my dashboard loading slowly?
Dashboards can take longer to load when they include many widgets or large, unfiltered views. For best performance, keep widgets focused and use filters to limit how much data each widget needs to display.
