It’s the year of agents writing data.
Among those using agents, the share with write permissions increased from 52% to 90%. Yet, there’s no consensus on how to properly monitor and set up guardrails for them.
Notion × Amplify × Vercel
About everything from which models they’re using to how they approach cost to whether their non-technical teammates are shipping features
Among those using agents, the share with write permissions increased from 52% to 90%. Yet, there’s no consensus on how to properly monitor and set up guardrails for them.
Three-fourths are adjusting their AI usage based on cost, and 40% say cost regularly shapes how ambitiously they use AI.
More than half are using them, but almost all alongside closed source ones.
81% use multiple models, but over 50% say there's at least some standardization occurring on fewer AI tools at their org.
Who exactly is working on the engineering side of AI? The largest group of respondents described themselves as founders or AI Engineers.

 Which best describes your current role?
For the 3rd year in a row, many of the most seasoned developers out there are relative newcomers to AI: of respondents with 10+ years of software experience, 51% have 3 years or fewer of AI experience. At the same time, the leading edge is starting to even out: the share of respondents with less than 1 year of AI experience dropped from 1 in 10 last year to roughly 1 in 34 this year.
Reframe it by experience band and the gap is stark. Even very senior engineers with 10+ years of experience only have, on the median, 3 years in AI/ML. But look at the 0–3 bucket: more junior software engineers, as a percentage of their overall software experience, are more AI-native. If you’re getting into the workforce now, software engineering experience is AI/ML experience.
 How many years of overall engineering experience do you have? // How many years of AI/ML experience do you have?
Across the board, we’re seeing meaningful increases in usage in all modalities (especially outside of text, which basically everyone is using). Note that survey respondents are, by all accounts, a fairly AI-native group of people… and the majority of them still aren’t using most modalities. There’s such incredible growth yet to come.
The biggest jump from last year came from image generation. 2x as many (36% vs. 18% in 2025) say they’re using generative AI for images and it’s working well. Many of the best image gen solutions saw V2s over the past 6-9 months (e.g. NanoBanana 2, ChatGPT Images 2.0) and it seems to be paying off.
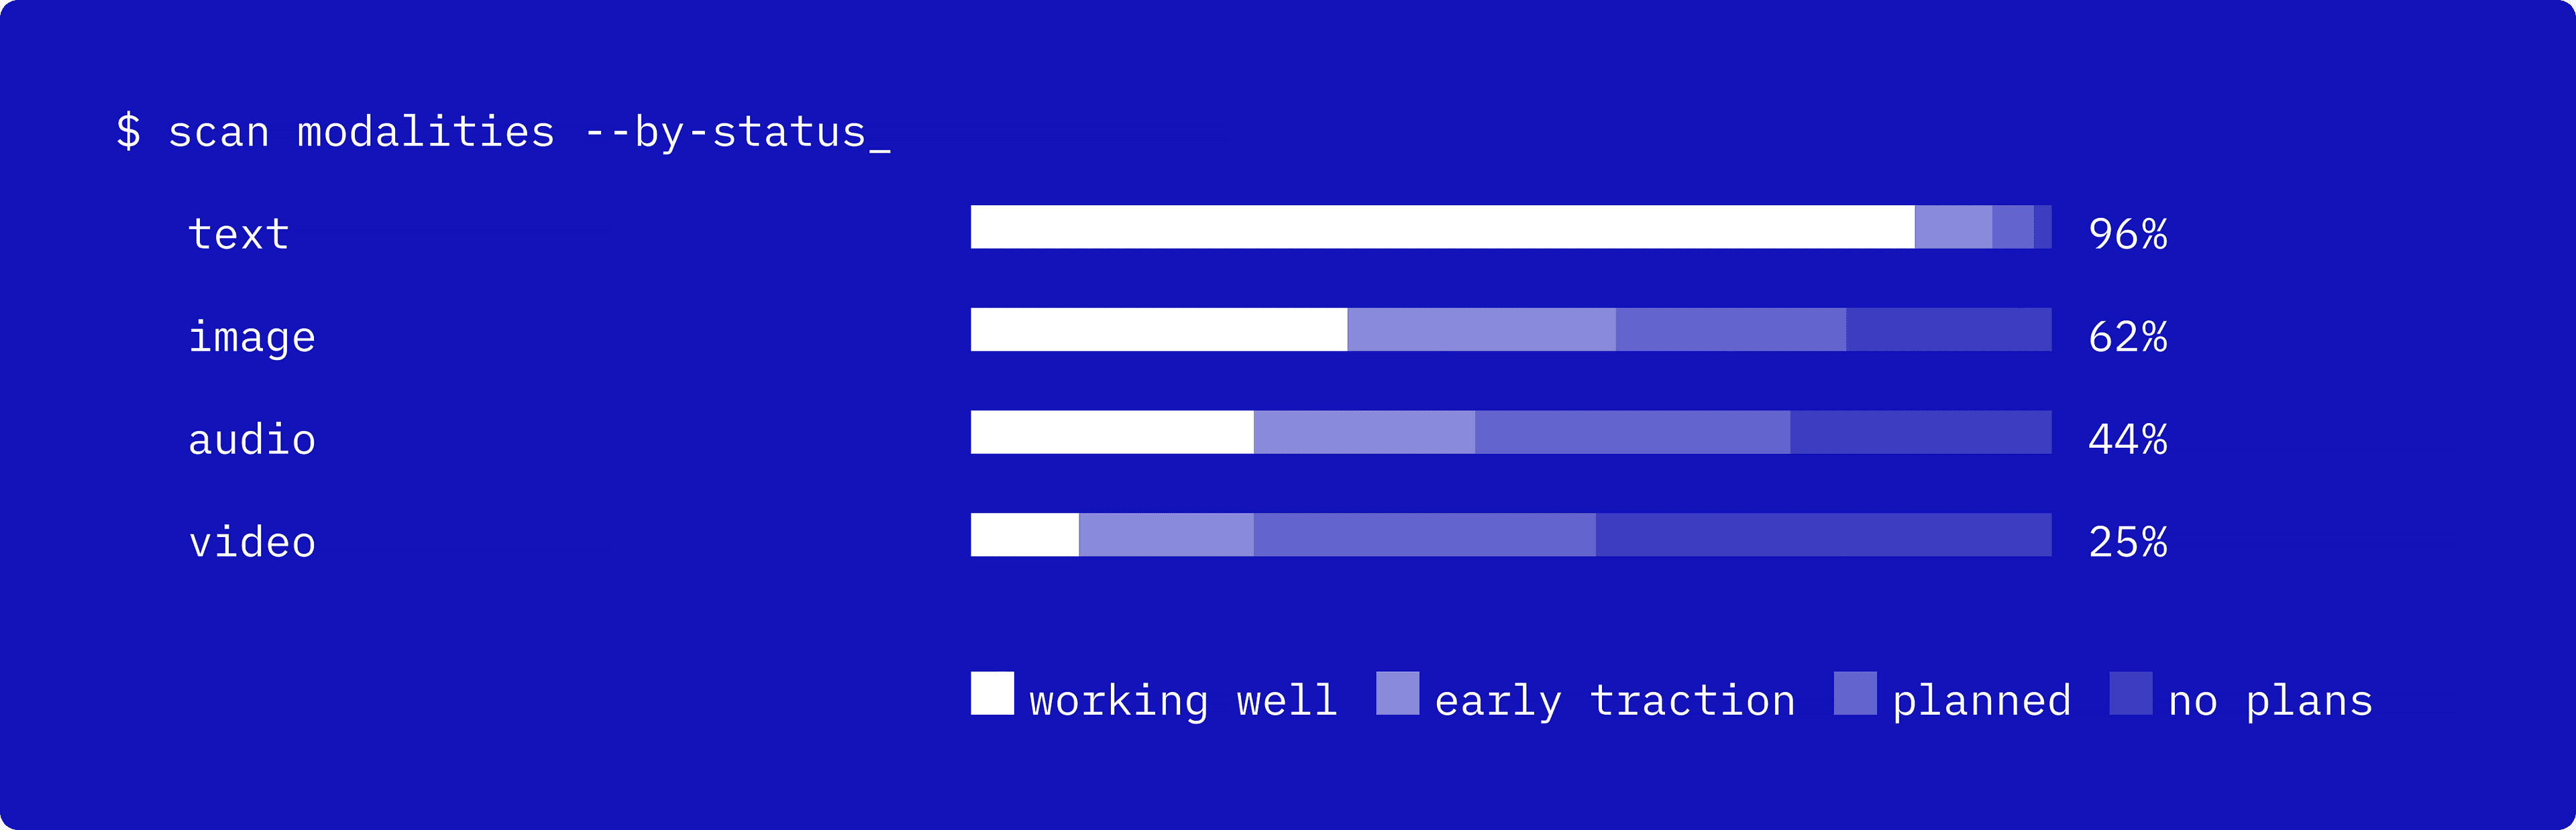 Which AI modalities are you actively building with at work?
One thing we’re all wondering: what’s going on with audio? Last year, we argued that audio was poised for a huge adoption swing; 37% who weren’t using audio said they planned to soon. There has definitely been growth since then – 24% are happily using audio vs. 17% last year – but it’s not the kind of growth you might have expected. Not only that, but the intent-to-adopt rate for audio is even higher than last year: 56% of those not using audio plan to use it soon.
There has been a lot written over the past few months about open weights. The data in the survey shows that they’re getting increasingly popular… but almost nobody is using them independently. Today open source is best thought of as a helpful companion to closed source but not yet a direct replacement.
Of the 54% using open-weight models — either out of the box (37%) or fine-tuned (17%) – >90% are also using closed models. Open vs. closed is actually only a primary consideration for 5%. The most important quality by far is… quality, followed by agentic capabilities and then cost (we’ll come back to this).
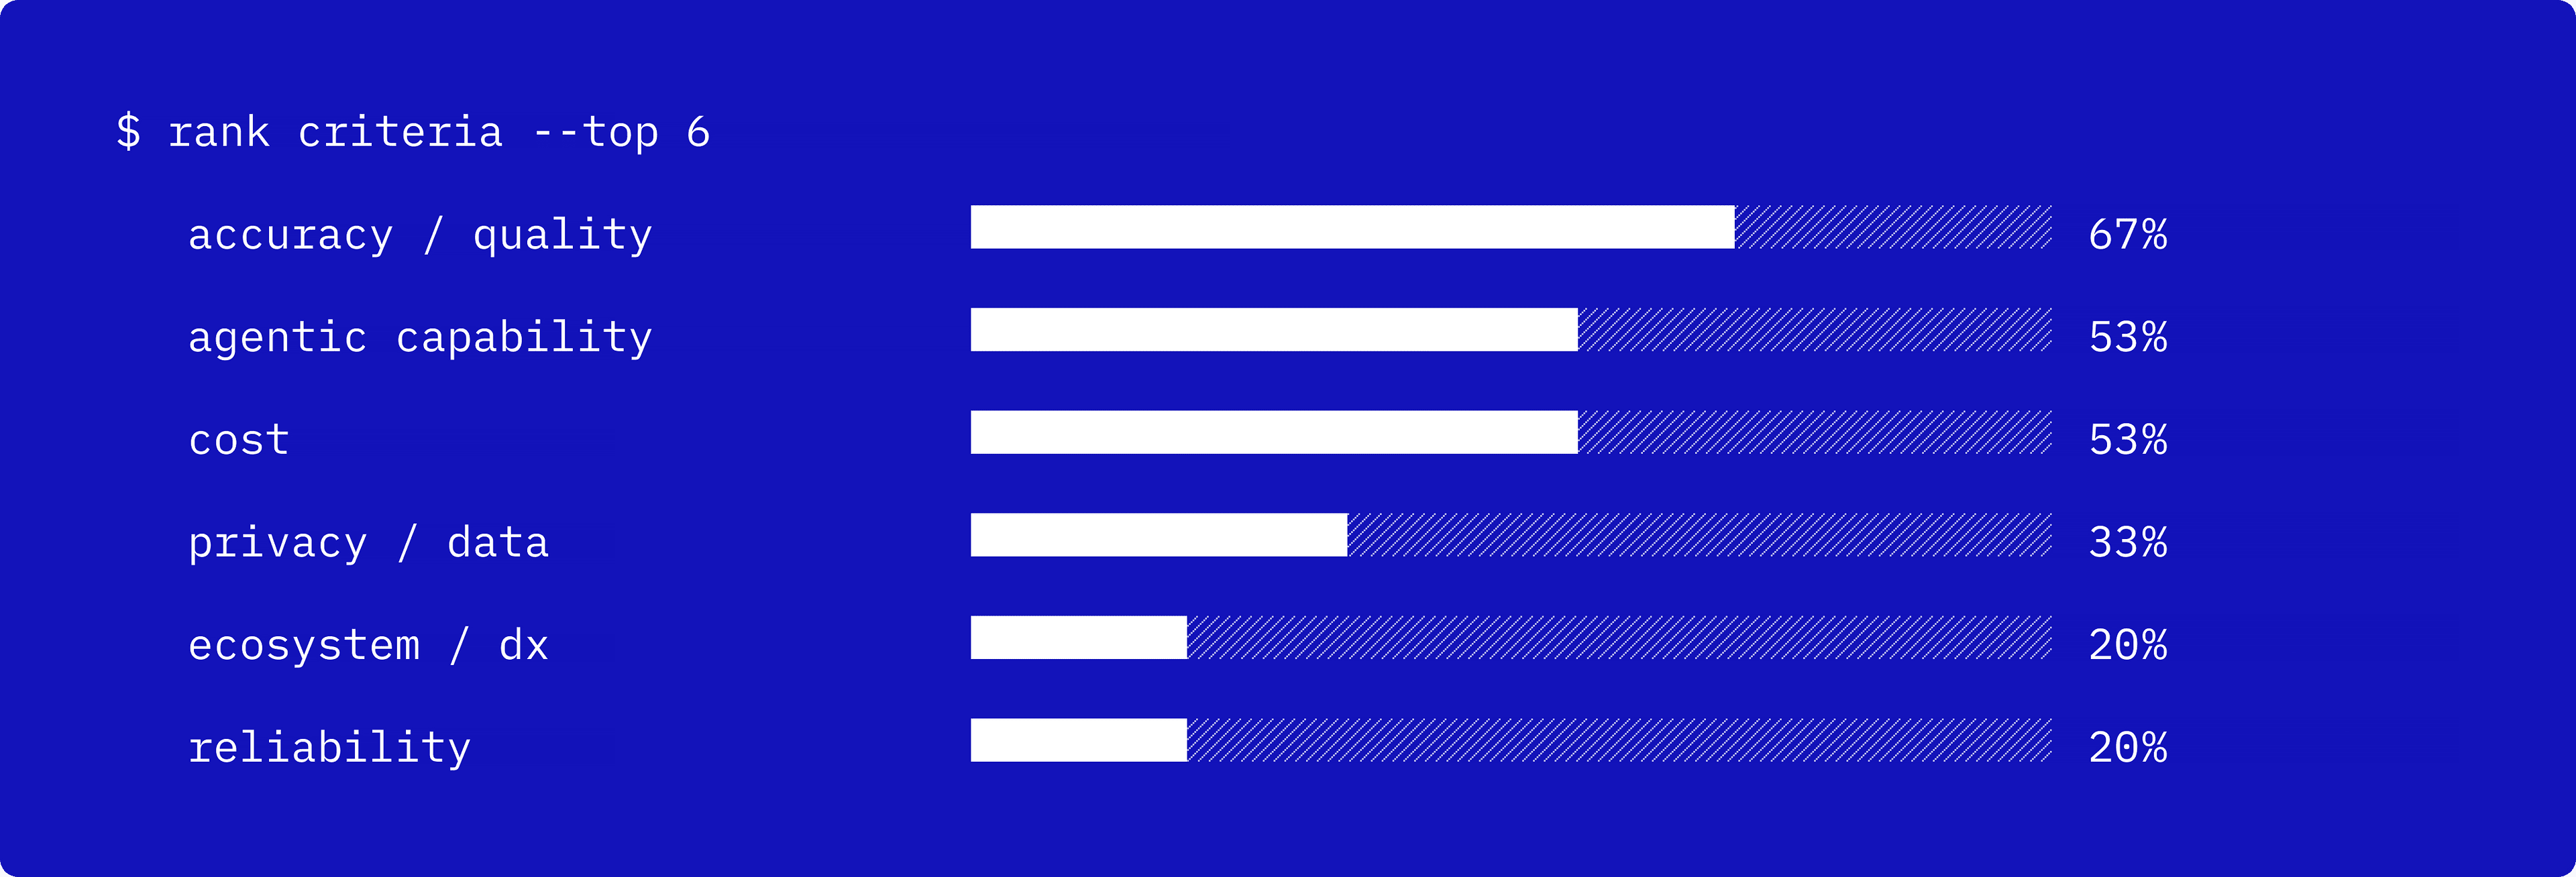 What are your top 3 considerations when choosing a model for production? · select up to 3
Only 20% put reliability / uptime in their top 3 considerations. This is an interesting data point when contrasted with the public X uproar every time Claude Code has an outage. It’s annoying when models aren’t working, and sometimes you just want to complain about it – but as long as they work most of the time, people don’t seem to really care.
The overwhelming majority (81%) are actively using multiple models together. 44% route by task type, 26% run multiple and compare outputs, and 11% route based on cost. But this might not last. The data imply that the Great Standardization may be coming: >50% say there is at least some standardization occurring on fewer AI tools within their org.
 For a given task, how do you decide which model to use?
Thematically, 2025 was all vibes and pure usage while 2026 is shaping up to be the year where we started thinking about value. As model improvements flatten out and prices continue to go up, we are starting to see cost play a major role in how organizations make AI decisions.
40% say cost regularly shapes how ambitiously they use AI, and 36% say it sometimes does. All in all, three-fourths are adjusting their AI usage based on cost. This sounds… obvious, but if you can put yourself in your own shoes just 12 months ago, it was anything but.
 Has cost ever made you dial back your AI ambitions?

Agents were a meme in 2025 and are now just how AI is used in 2026. Agent usage nearly doubled relative to last year. Among teams using agents, 90% say those agents can write data, compared with 52% last year. But the majority still require a human in the loop.
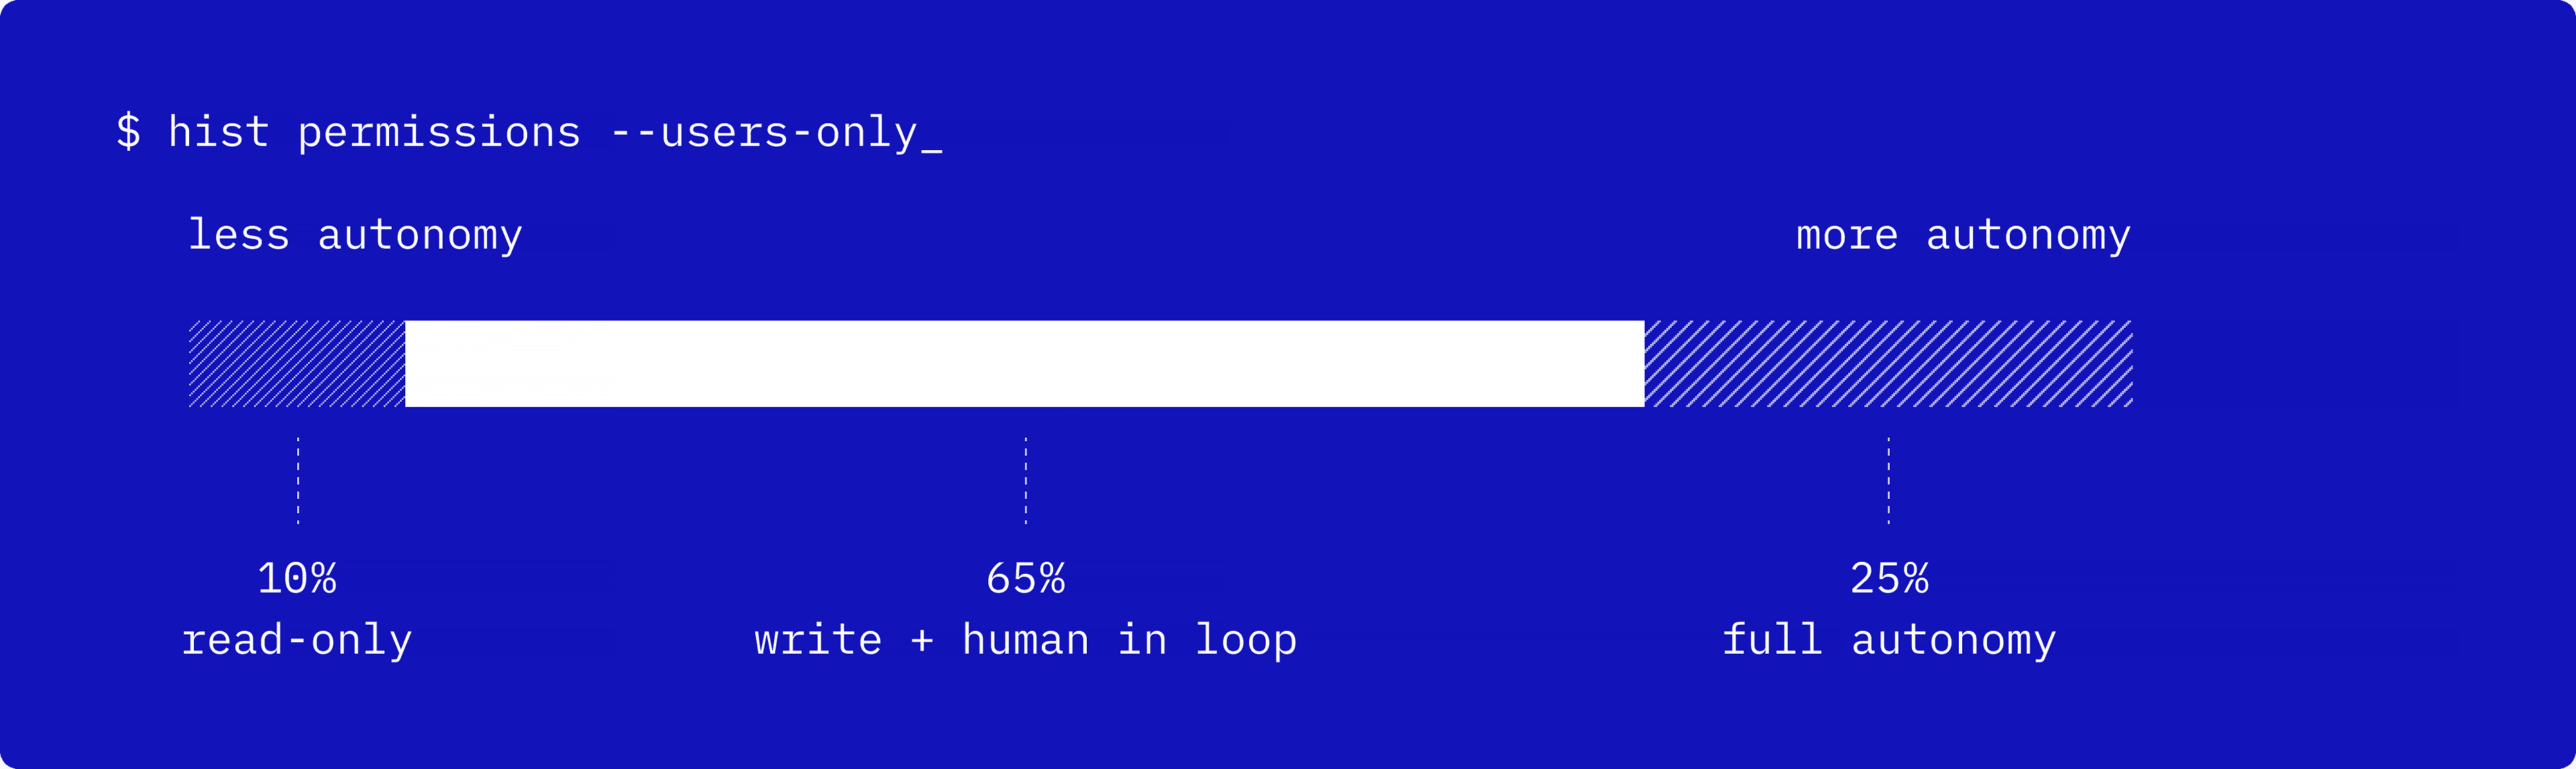 What level of tool permissions do your agents have? · among those using agents
Part of the reason agents can’t fully roam free yet is that nobody is quite sure how to control or manage them. What we would call fairly primitive guardrails are the top 2 options in the survey — human in the loop approvals, and simply gating agents from permissions — while results are scattered for other strategies. People are basically trying everything.
The area where agents mess up the most is in the quality of their responses: 61% say that where agents fail or frustrate them the most is hallucinations.
 Where do agents fail or frustrate you most? · select up to 3 // What infrastructure or controls do you use to manage agent behavior?
The cost narrative continues: cost is one of the most highly monitored items in production (after quality / task success, duh). Almost half are actively monitoring cost in prod.
 Once AI features are in production, what do you monitor most closely? · select up to 3
When it comes to actually adapting model behavior based on these supposed evals everyone is talking about, the majority are still (just) updating their prompts. This is starting to feel a bit primitive and nobody really talks about prompt engineering anymore. But here it is.
Another potential narrative violation: almost 50% say they’re using RAG of some sort.
 Which techniques are you using to adapt or improve model behavior for your product?
If we zoom out to look at the AI engineering stack as a whole, there’s no widespread agreement on what the biggest challenge is. Evals, orchestration and agent logic, inference, and security are all within a few points of each other on the survey. In other words, we have a long way to go (a solid 4% think the stack is working well).
 Which layer of your AI stack is currently your biggest challenge?
We asked respondents about how they’re approaching build vs. buy for different layers of the stack. They were able to mark whether they’ve built or bought for particular layers, plus whether they’re happy with that decision or are considering switching (e.g. have built fine-tuning, but are considering buying instead).
 How have you approached each layer of the stack?
One of the most interesting takeaways is that inference / model serving is far and away the most commonly bought layer of the stack: 45% have bought (highest in the survey, 37% happy with that decision) and only 23% have built (lowest in the survey).
Prompt management is the opposite. Out of all layers of the stack, it’s the most commonly built and least commonly bought.
On the reverse side, we asked where AI has been the most impactful on their development stack. A surprising takeaway is that AI has impacted all parts of the SWE stack, not just codegen: almost half (48%) say planning and spec writing, and even 28% say backend / API.
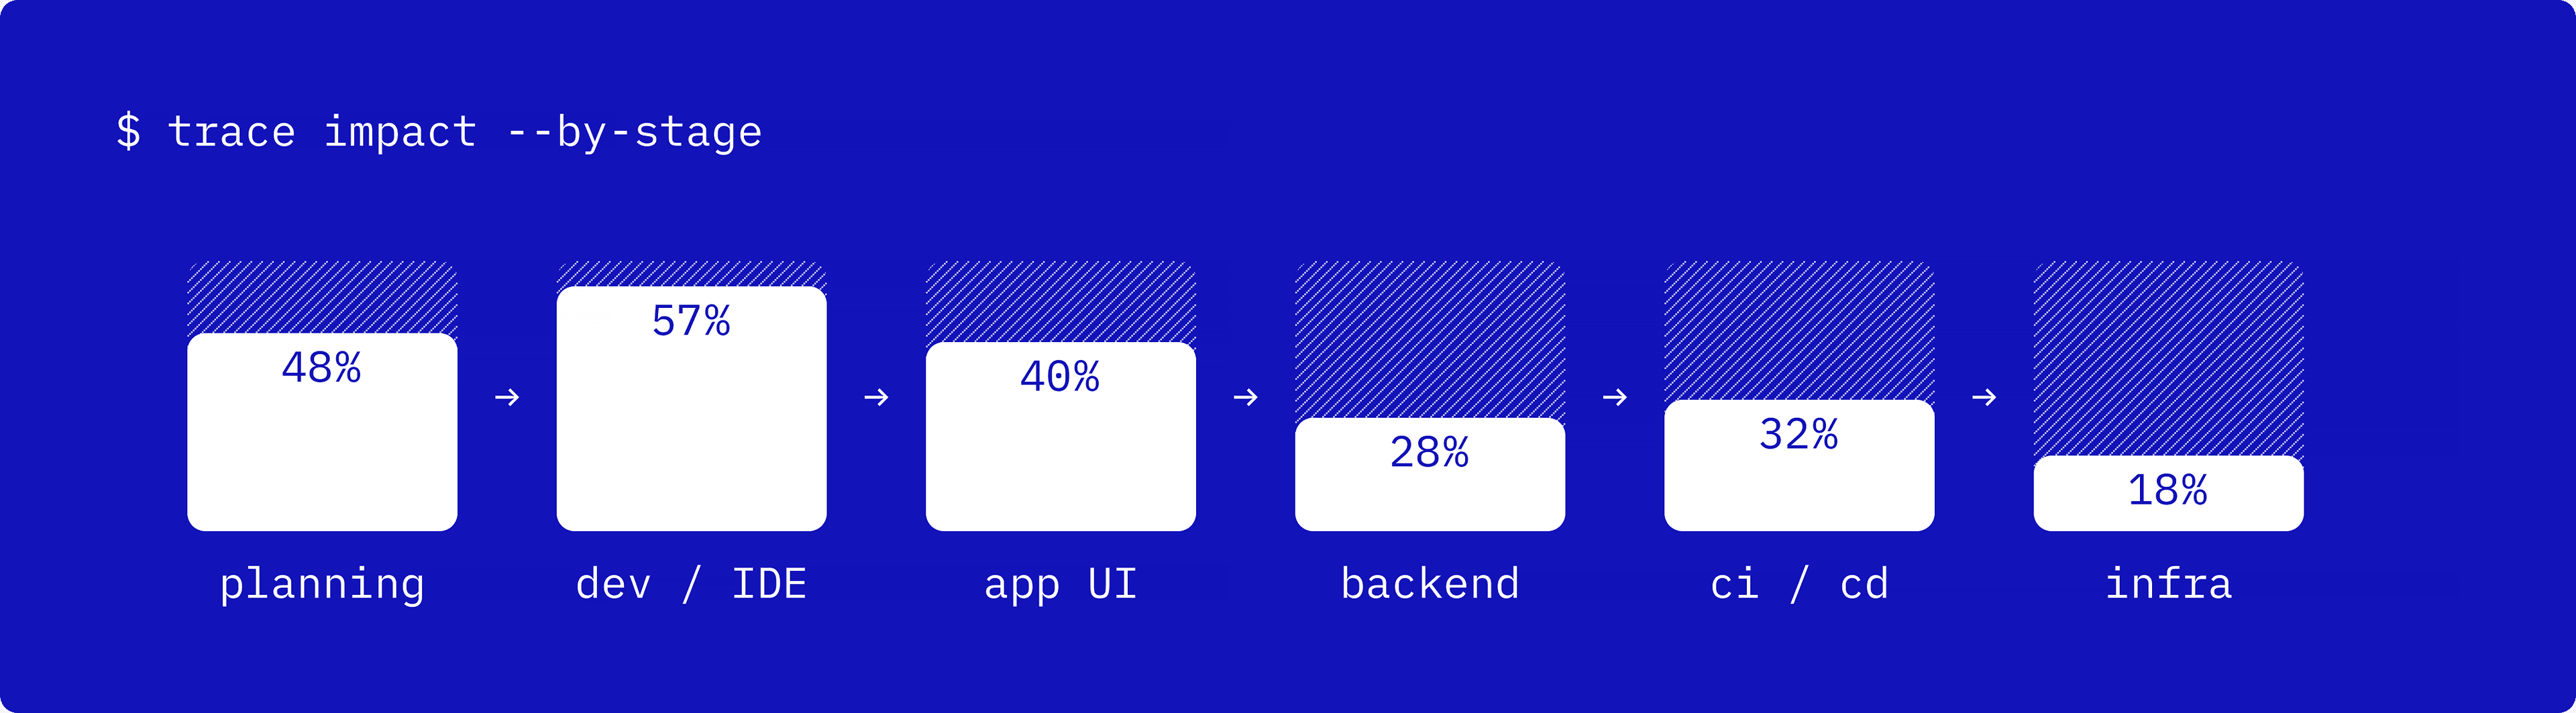 Where in your development and deployment pipeline has AI had the biggest impact? · select up to 3

We are clearly seeing AI move from experimental / tinkering technology to broadly impactful on the organization. The good news is that basically every respondent (97%) is feeling a positive downstream effect of AI in the org – largely around experimentation and faster shipping.
But there is a cost to every dalliance. 93% are also feeling negative downstream effects, the most common being a widely discussed erosion of deep technical skills and understanding. All of the consequences of infinitely cheap code generation show up here.
 What's the most positive + negative downstream effect of AI-accelerated development for your org?
Because of all of this, traditional roles in the product organization are already blurring. 44% say this is happening in a significant way and another 37% say it’s happening somewhat.
This is perhaps most acutely felt as it relates to shipping software, once a domain exclusively of the engineer. <50% say that non-developers are shipping at least features, mostly internal. But 17% say that they are regularly shipping full size customer-facing ones, which blows my mind. And of that majority that aren’t shipping features, many (32%) are at least building helpful things internally.
Finally, we asked everyone if they agree, aren’t sure, or disagree on some fundamental takes related to AI Engineering.
 Rate each statement
We then did the same thing, but for 5 years out. Will agents be making purchasing decisions? Will SOTA models still be closed source?
Save for maybe AI-generated AI research ideas, the only commonality among these topics is that everyone is split on them. Interestingly, only 9% believe that Transformers are the final boss architecture (and yet 5 years into this, we still don’t have a viable alternative).
 In 5 years…
$ feedback --submit
anywhere you’d want more data? questions we should ask next year?
let us know, find us at @NotionDevs // @AmplifyPartners // @vercel_dev
and thanks to those who filled this out
$
$ cat methodology.md
this report draws on 1,053 survey responses collected between May 16 and June 15, 2026 by Notion, Amplify Partners, and Vercel
percentages are shares of those who answered, and denominators vary by question; multi-select questions can total more than 100%; some percentages are rebased to a subset of respondents, these are noted where they appear