88%
say they’re much more productive with AI
Notion × Amplify × Vercel partnership
Confident in the gains, uneasy about the foundation. How more than 1,000 engineers, founders, and product leaders are actually building with AI in 2026.
The strongest signal in this data isn’t a single number — it’s a tension. Engineers are sold on the speed and the satisfaction. They’re far less sure the foundation under all that velocity will hold.

say they’re much more productive with AI
report higher personal job satisfaction
expect AI‑generated code to create major long‑term liabilities
reject that AI software engineering is “a solved problem”
The picture is of a workforce that has wholeheartedly adopted the tools and is now quietly worried about the bill that comes due: in skills, in review load, and in brittle systems. Six tensions trace that fault line across models, agents, evaluation, roles, and beliefs.
The engineers who hand agents the most autonomy aren’t the most careless, they’re the most rigorous. The quarter who allow full autonomy run formal evaluations at a higher rate (75% vs 66%) and lean on more evaluation methods to do it. Autonomy here is earned through measurement, not granted by inattention.

 What's the most positive + negative downstream effect of AI-accelerated development for your org? · n=798
Read everything here through one lens: this is a particular, fast-moving slice of the field. It’s the crowd already living in the deep end. 1,053 people responded, and they skew heavily toward founders and engineers at small, AI-native companies:

 Which best describes your current role? · n=1,053
Roughly 68% are at companies of 100 people or fewer. These are seasoned software engineers, relatively new to AI (a median of eight years writing code, three in AI/ML). The gap is broad: even among those with 10+ years in software, 51% have three years or less in AI. The one place it disappears is the leading edge — for the newest engineers, learning to build and learning to build with AI are the same thing.
Six tensions surface again and again. Each time, a confident majority leans into what AI makes possible while a sizable share keeps one eye on the catch — and more often than not, it’s the same person, holding both at once.
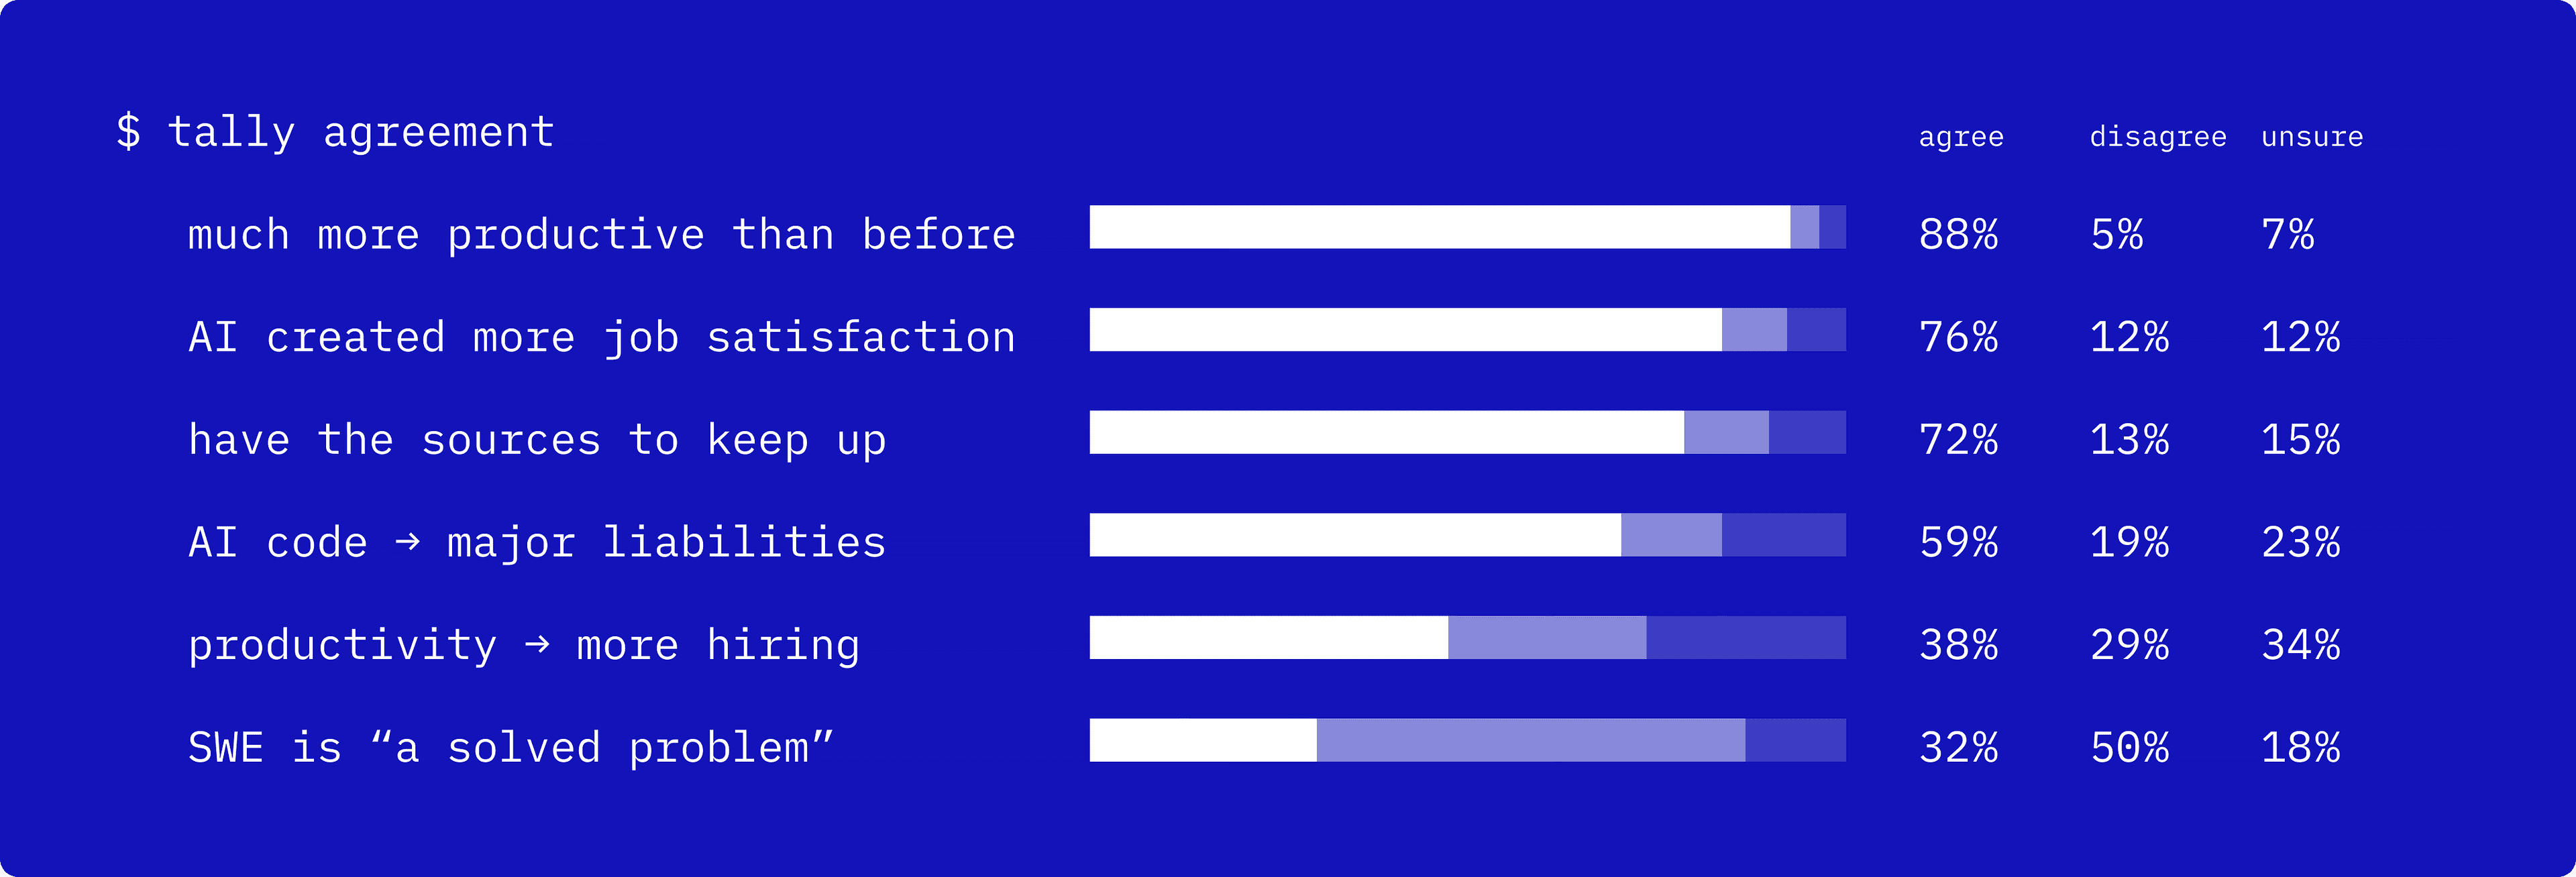
 Left = adoption/optimism · Right = caution/unease · n varies 762–1,053
The gains aren’t in dispute, what they rest on is.
88% feel markedly more productive and 76% report more job satisfaction. There’s no real debate about the gains. The doubt is structural: 59% expect today’s AI-generated code to create major long-term liabilities, and a heavier review burden (28%) and more brittle, incident-prone systems (22%) rank among the costs they name most.
They select for accuracy, then get reined in by the bill.
Accuracy is the top model-selection criterion (67%), comfortably ahead of cost (53%), yet in practice roughly three in four say cost reins in how ambitiously they use AI. The model they’d choose and the model they can afford to run aren’t always the same.
Sophisticated stacks, still judged by feel.
These teams run real production systems (retrieval, orchestration, monitoring) but the most common way they check outputs is manual review and “vibe checks” (61%), ahead of any formal method, and evaluation is the single hardest layer of the stack to get right (20%). The tooling has outrun the measurement.
Agents get the keys, not the wheel.
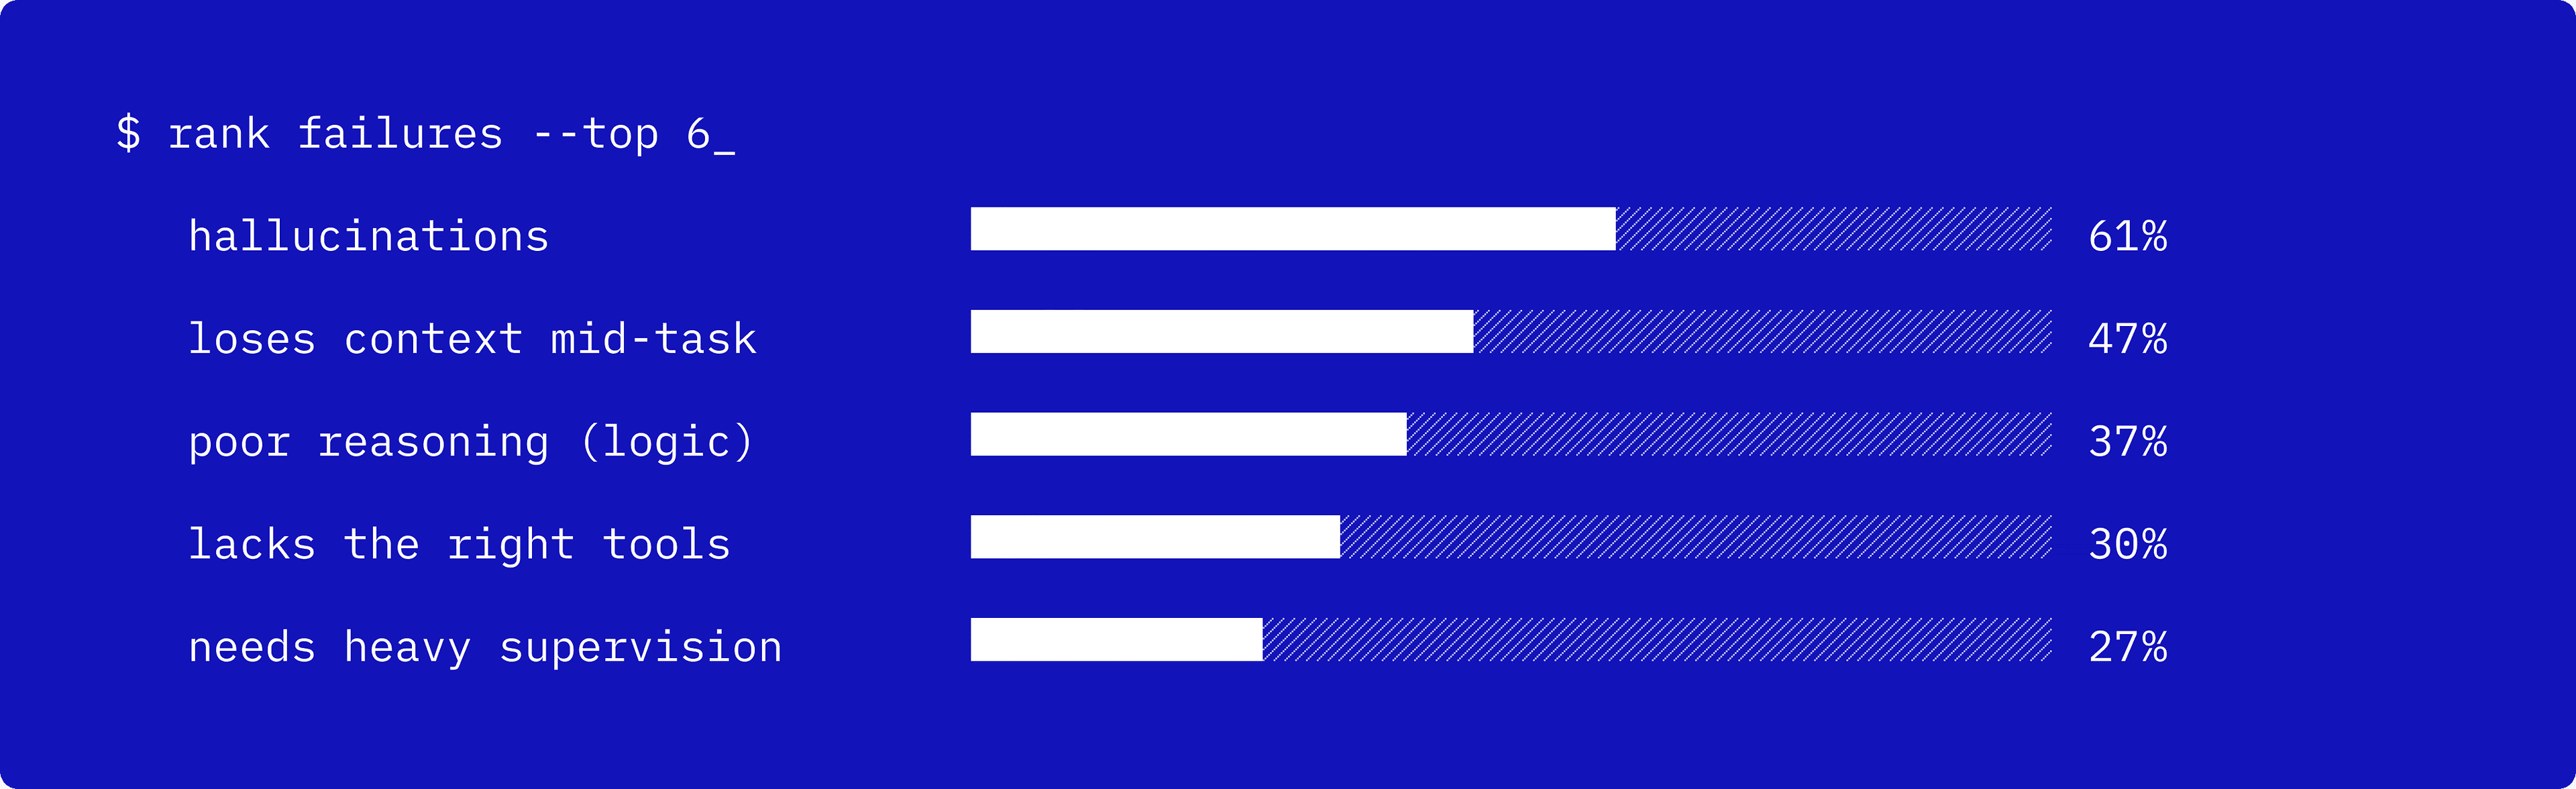
Among the teams that use agents, 65% grant write access but keep a human in the loop; only 25% hand over full autonomy. The holdup isn’t whether agents are capable, it’s whether they can be trusted to run unwatched. They still hallucinate (61%) and lose the thread mid-task (47%), so they don’t get to drive fully unsupervised.
The boundaries dissolve; the human core holds.
81% say their role is blurring into product, design, and marketing, yet the judgment at the center of the job is exactly what AI has left least touched. The edges are melting; the core isn’t. The democratization has a ceiling, too: only about a third of non-developers ship anything customer-facing, and just 17% do so regularly, so the production surface stays gated by engineers.
Feeling on top of it, fearing it dulls them.
72% feel they have the sources they need to keep up with AI. They don’t feel left behind. Yet what they fear most is that the same tools are quietly eroding their skill — on top of it, and worried about exactly that.
The rest of the story is how these tensions play out: in the models teams pick, the agents they deploy, the way they check their work, and where AI lands in the pipeline.

Closed models are still the ground everyone builds on: 94% use proprietary models like GPT, Claude, or Gemini, with open weights a real but secondary presence (37% as-is, 17% fine-tuned). When choosing a model, accuracy (67%) outranks cost (53%), with agentic / tool-calling capability now the second-ranked criterion.
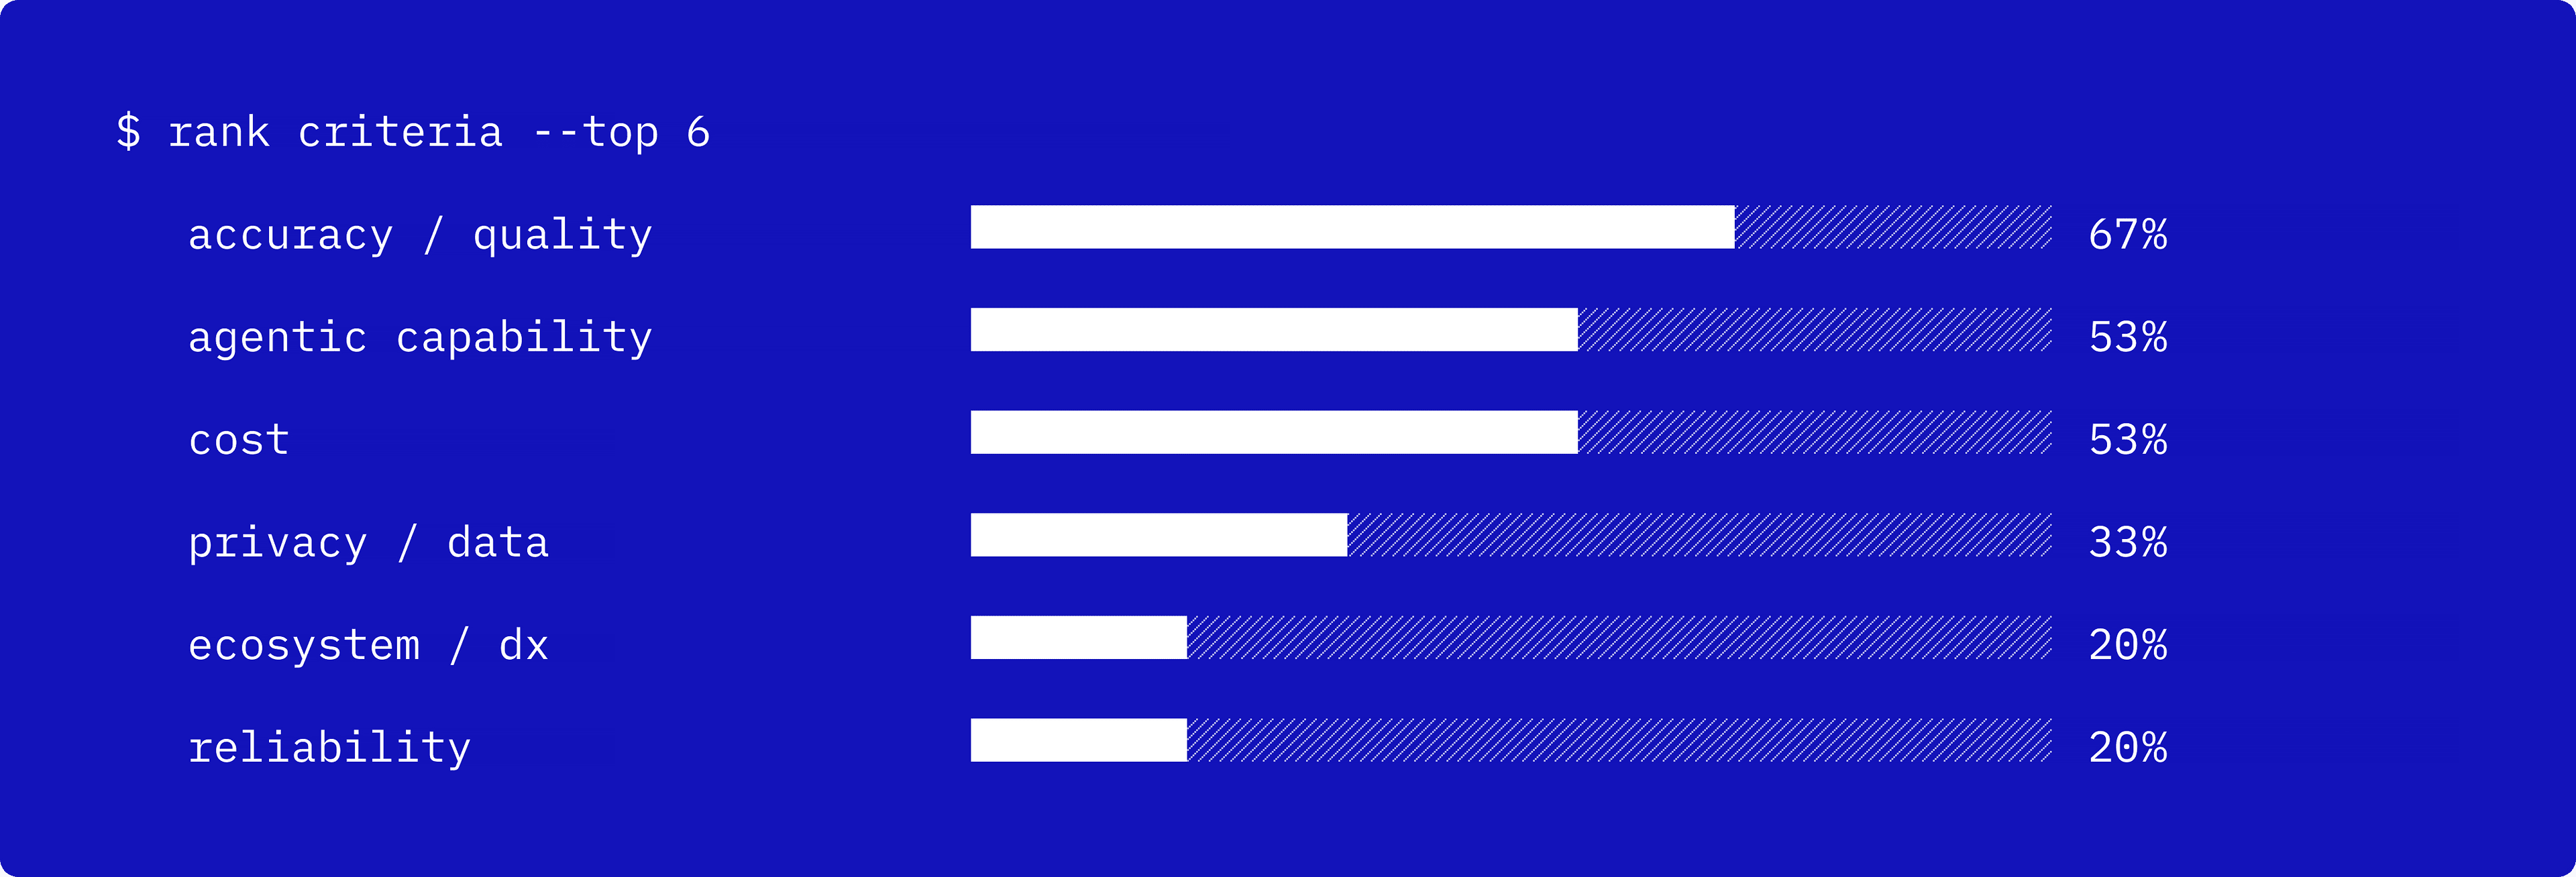
What are your top considerations when choosing a model for production? select up to 3 · n=1,004
More than 80% are actively multi-model: routing by task type (44%), running several and comparing (26%), or trying a cheaper model first and escalating (11%). Yet roughly three in four say cost reins in how ambitiously they use AI.
Zoom out from individual models to the broader toolset, and an early pull toward consolidation shows up: a slim majority (56%) report standardizing on fewer, better-vetted tools, even as a plurality (37%) deliberately keep the stack flexible. A wave of standardization may be forming.
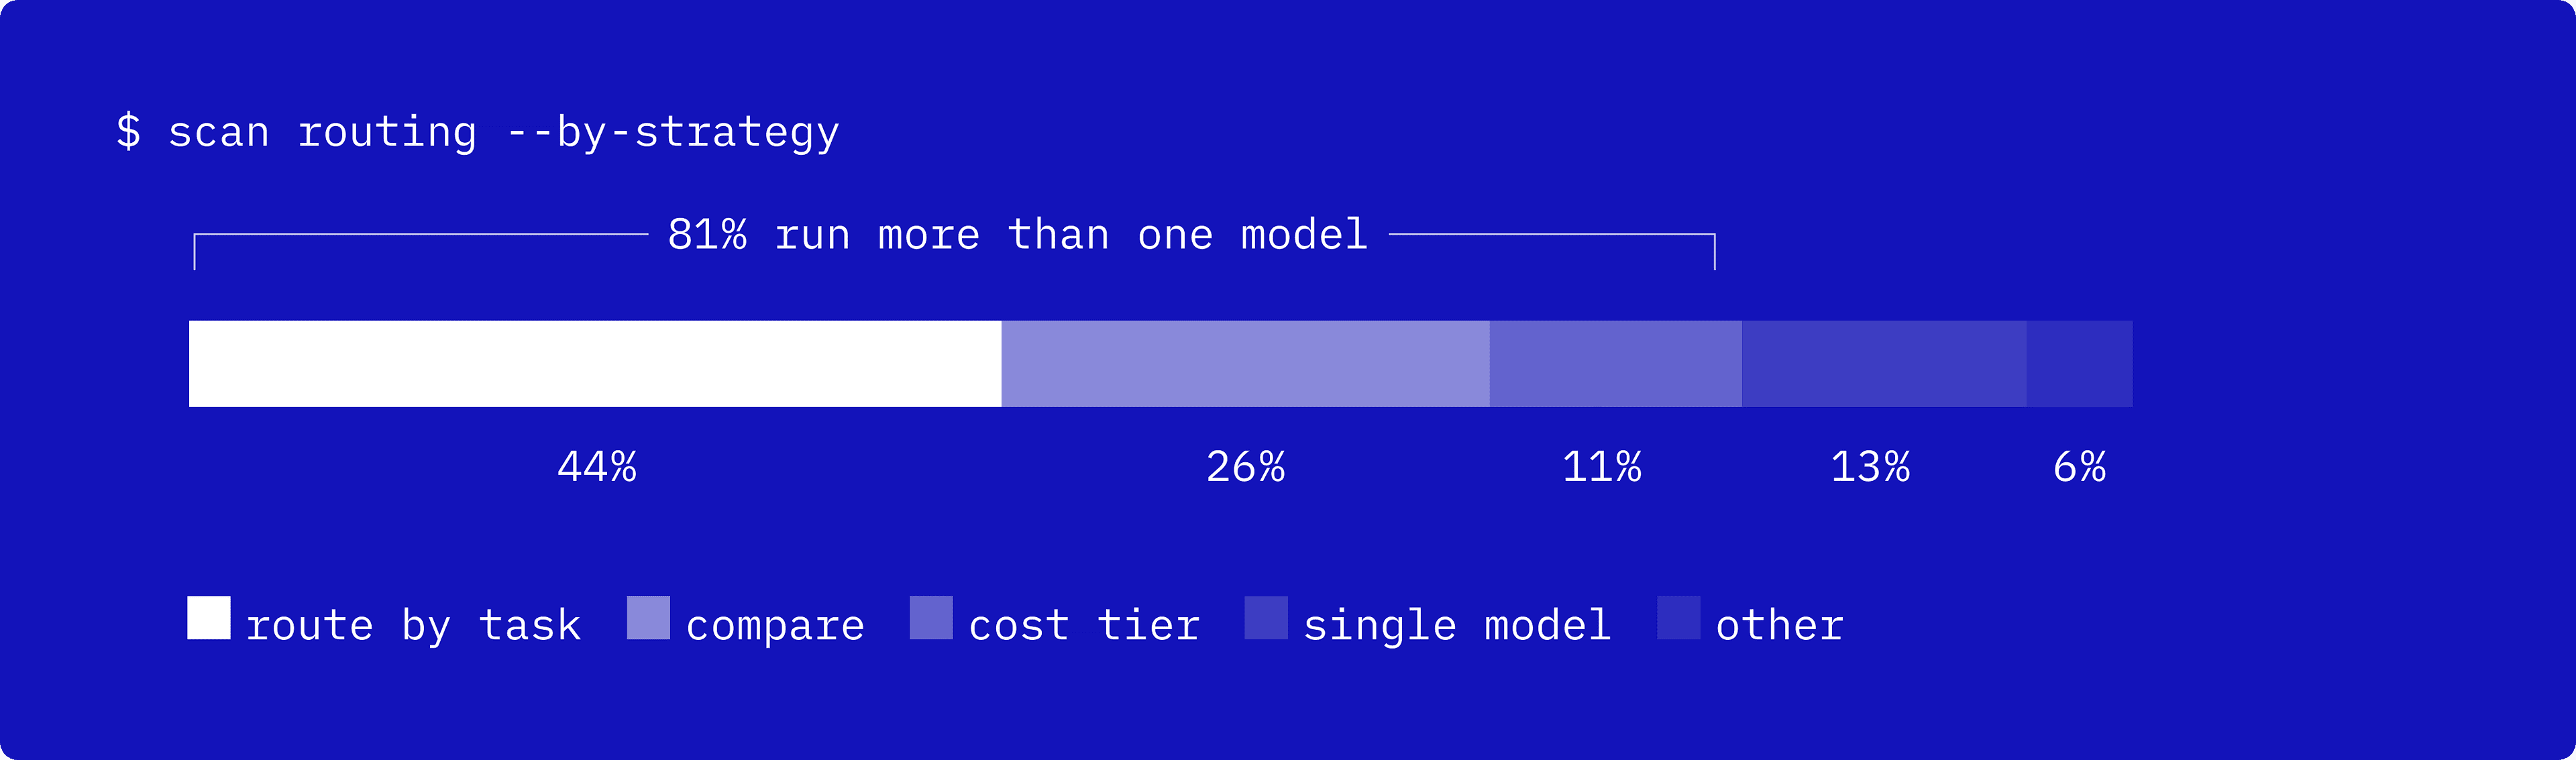
For a given task, how do you decide which model to use? · n=1,001
The model was the bottleneck. It no longer is — more often than not, it’s the tools it has access to.
Text is the substrate nearly everyone builds on: 96% are actively working with it. From there the frontier falls off fast — image 62%, audio 44%, video 25%. The more telling figure is the backlog behind each: audio and video carry the highest latent demand of any modality, with roughly a third of teams planning to add what they don’t yet use. Multimodal, for now, is a near-future bet more than a present-day default.
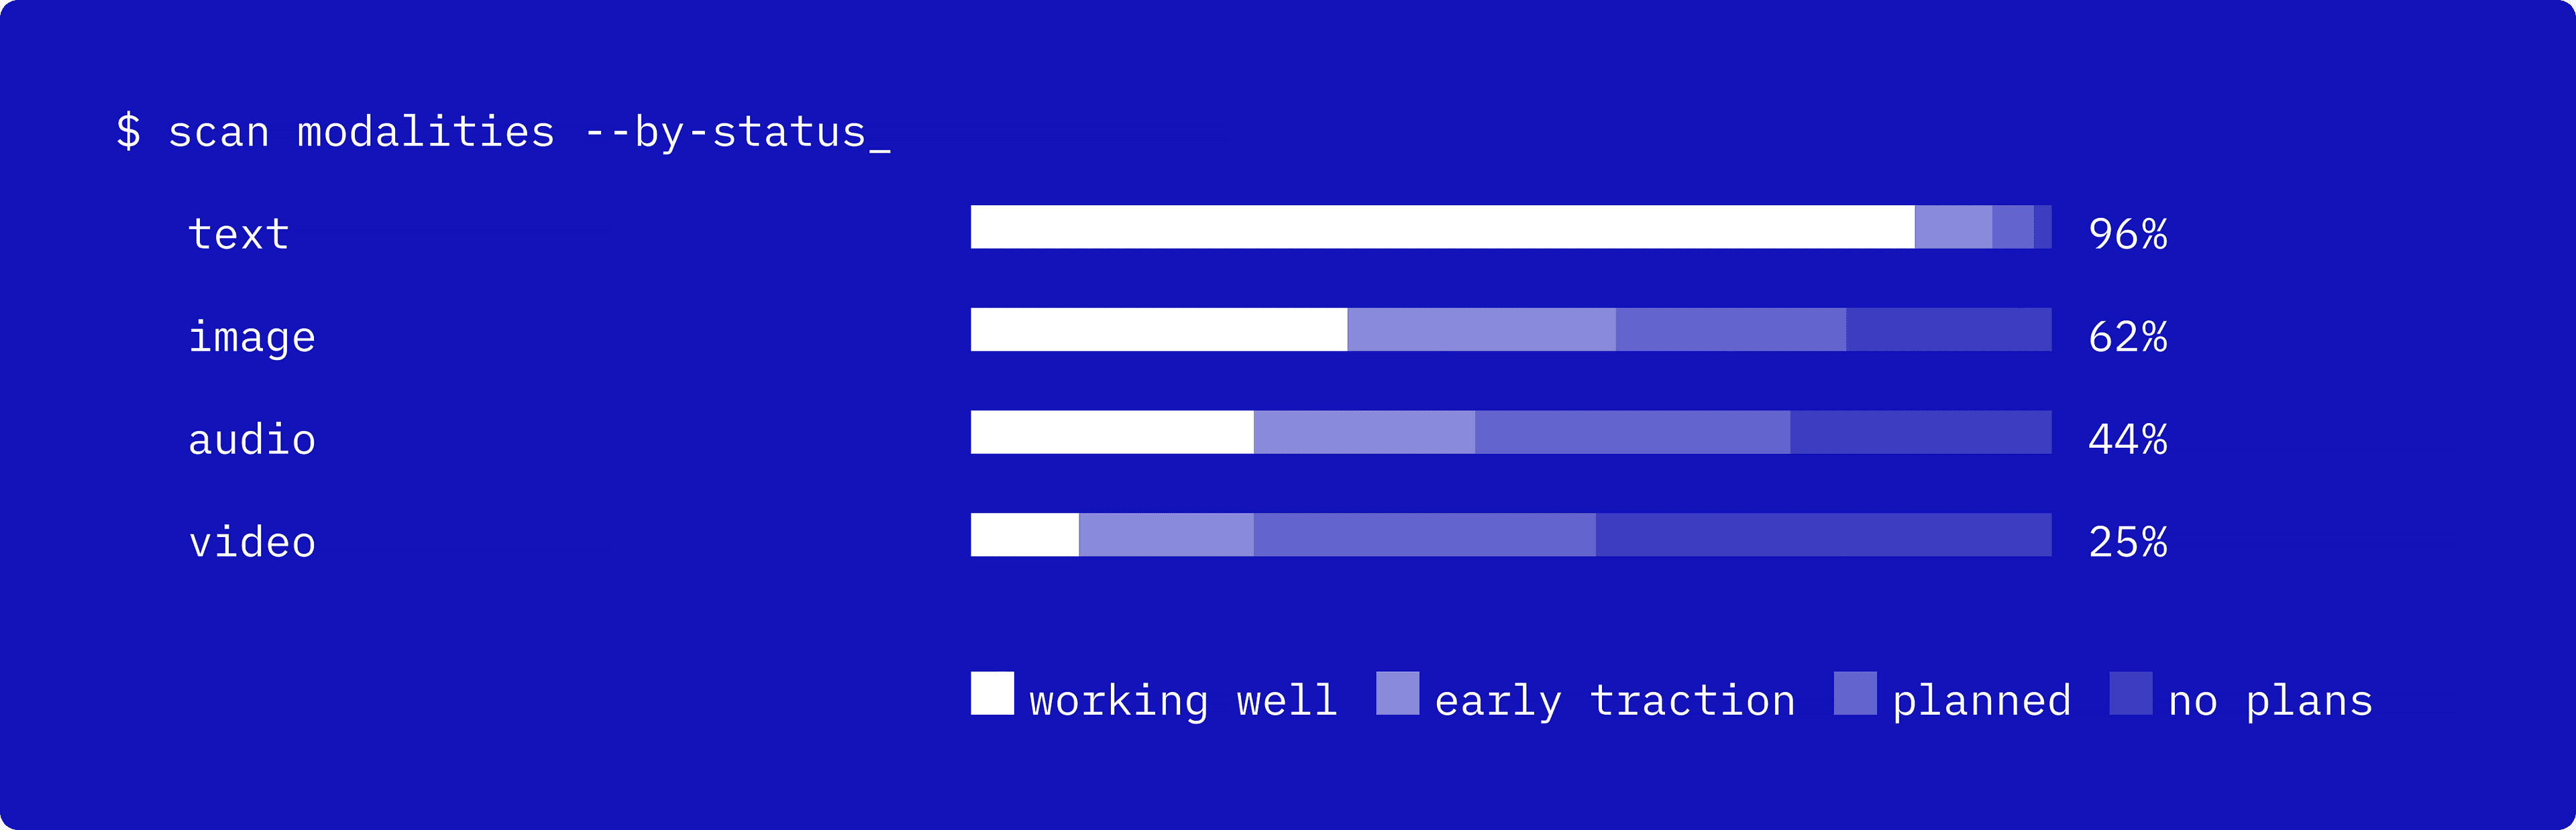
Which AI modalities are you actively building with at work? · n ≈ 970–1,000
Agents are now near-universal: 95% of teams run them internally. Among those teams the story is motion — full autonomy has nearly doubled in a year — from 13% to roughly 25% of agent users, and yet the dominant posture still holds: let it act, but check its work, with write access typically paired with a human in the loop. Controls are layered on top (human approvals 73%, access controls 60%, planning steps 48%, retrieval 47%, memory 47%), and almost nobody (3%) leans on prompting alone.
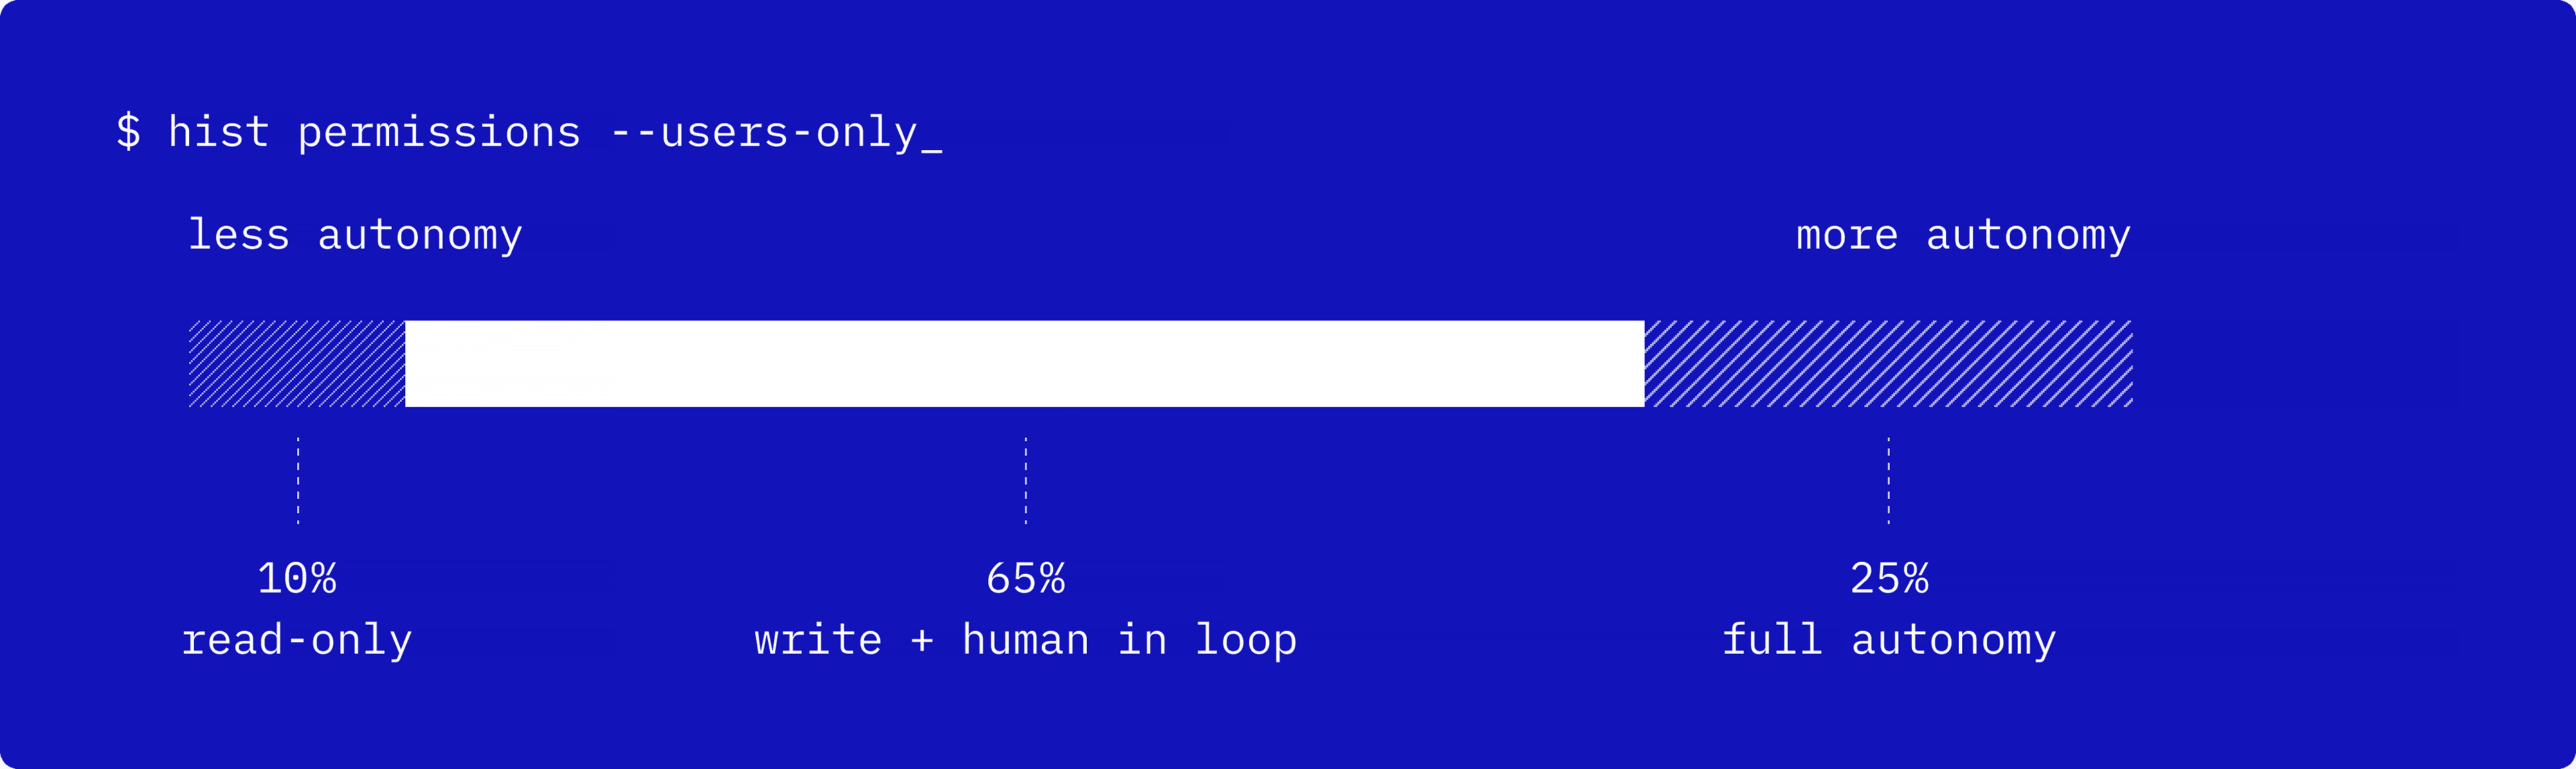
What level of tool permissions do your agents have? · n=930
The failure modes explain the caution: agents still hallucinate and lose the thread mid-task, well ahead of any ceiling on raw reasoning.
What level of tool permissions do your agents have? · n=930
The 25% who grant agents full autonomy aren’t the reckless ones, they’re the more rigorous ones. They use formal eval methods at a higher rate than the human-in-the-loop majority (75% vs 66%), run more eval methods each (3.1 vs 2.7), and are likelier to be shipping customer-facing features (59% vs 54%). Autonomy here is earned through measurement, not granted by carelessness; the evaluation and autonomy tensions are really one.
That bigger context windows would solve context loss. They don’t — the bottleneck was never raw tokens, it was structure. Compression and retrieval discipline beat window size every time.
Even this advanced crowd still grades by gut: manual review and “vibe checks” lead, ahead of any formal method, and one in nine has no formal eval process at all. Tellingly, evaluation is also the #1 named stack challenge (20%), ahead of orchestration and inference cost. The working toolkit for shaping behavior is prompting (80%), tool-use tuning (59%), and RAG (49%); fine-tuning remains a minority practice (26%). The meter-watching doesn’t stop at deploy: cost is the second thing teams track in production (48%), right behind whether it actually works (56%). The bill stays on the mind long after ship.
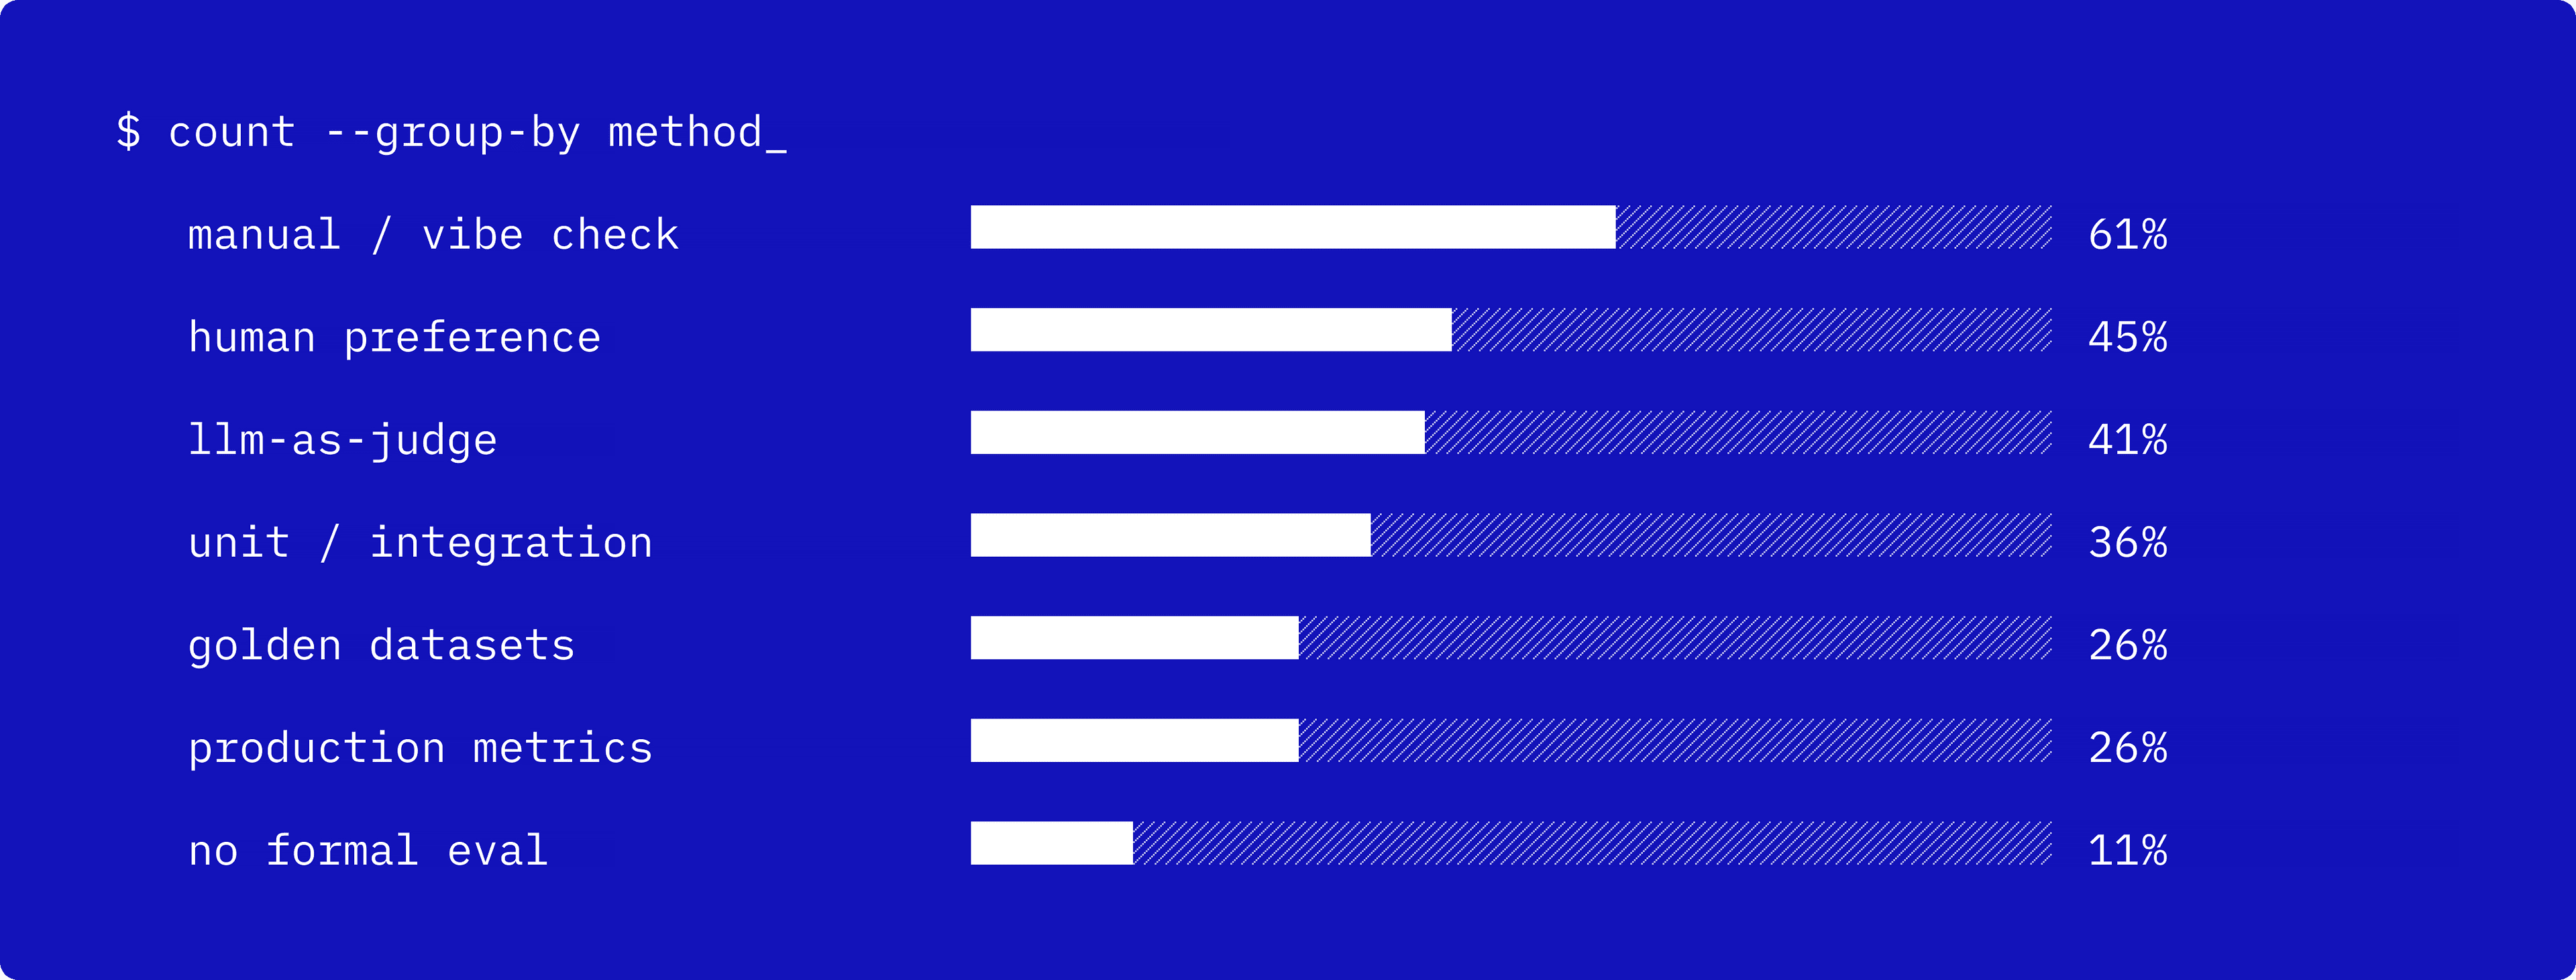
How are you evaluating AI outputs today? · n=893
AI hits hardest where the work starts — the blank page and the plan — but its reach runs deep, all the way through to CI/CD and the backend.
None of this is felt evenly. Split the sample by how close people sit to the code, and the central tension comes into sharper focus.
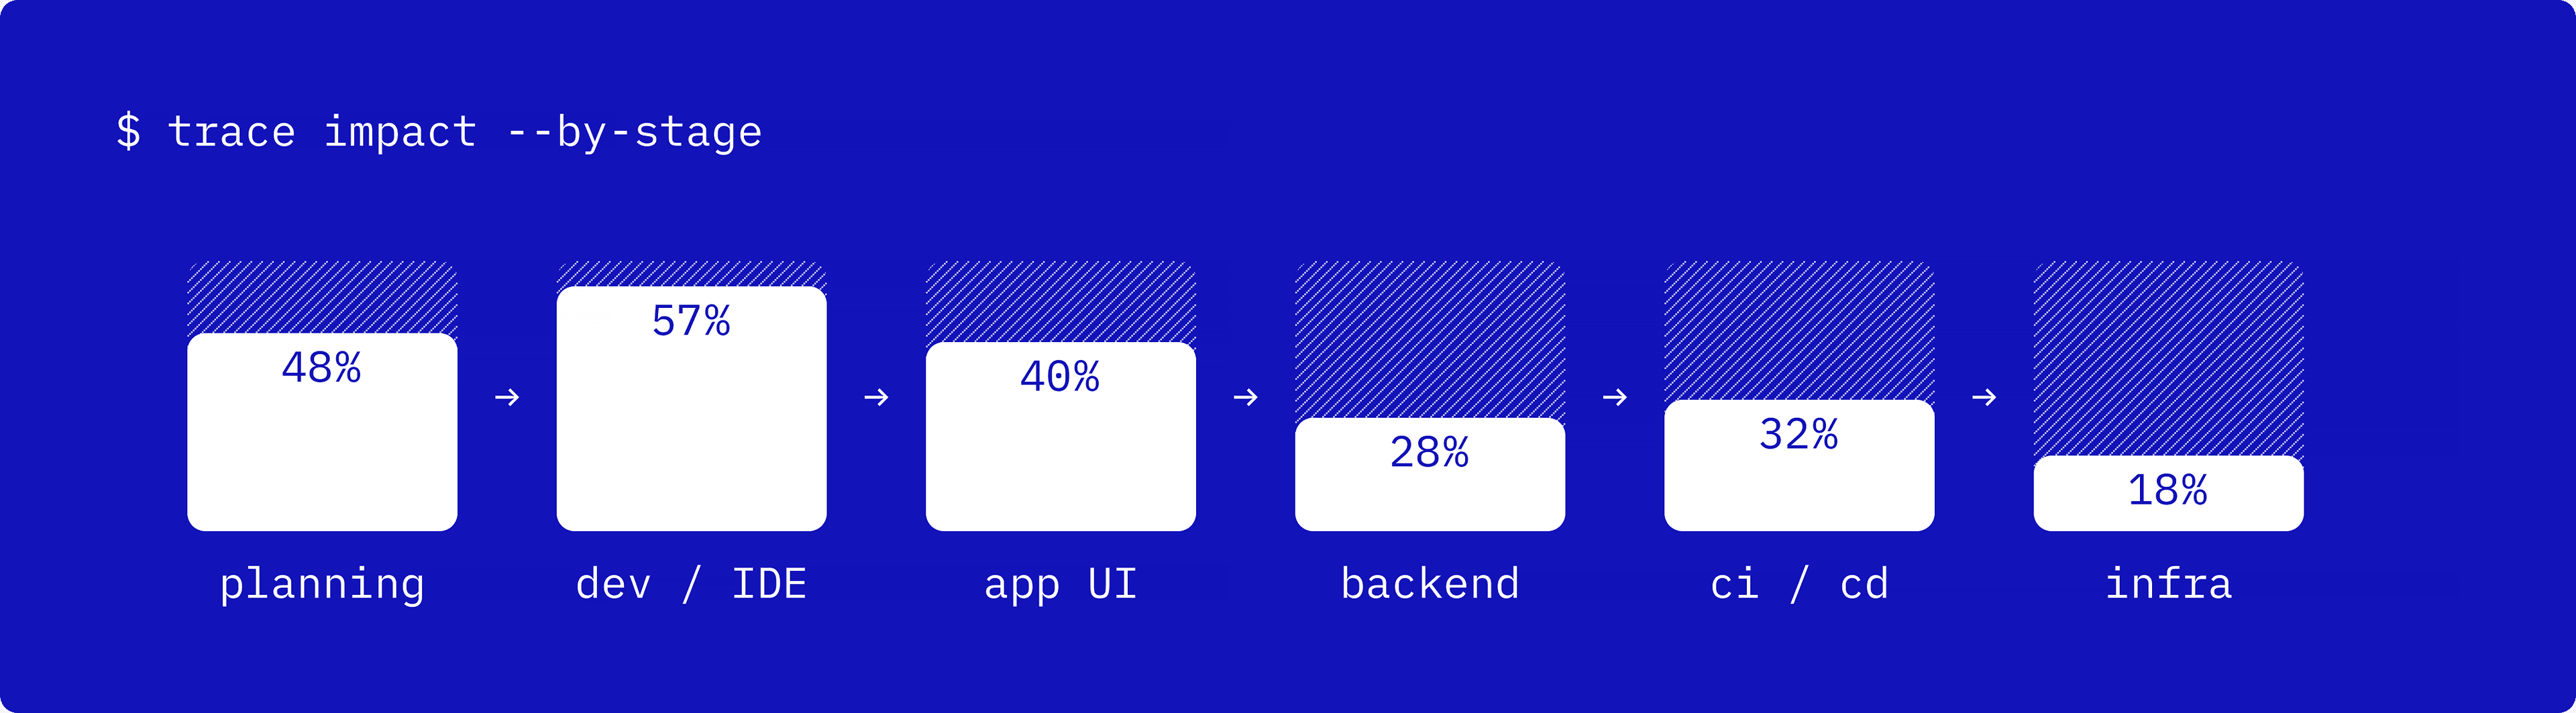
Where in your development and deployment pipeline has AI had the biggest impact? · select up to 3 · n=831
The mirror image is just as telling. Asked where AI has changed their work least, engineers name the human and judgment-heavy core: hiring, onboarding, and knowledge transfer (39%), architecture and system design (29%), and security review (27%) — the mentoring and system-level judgment that doesn’t reduce to typing.
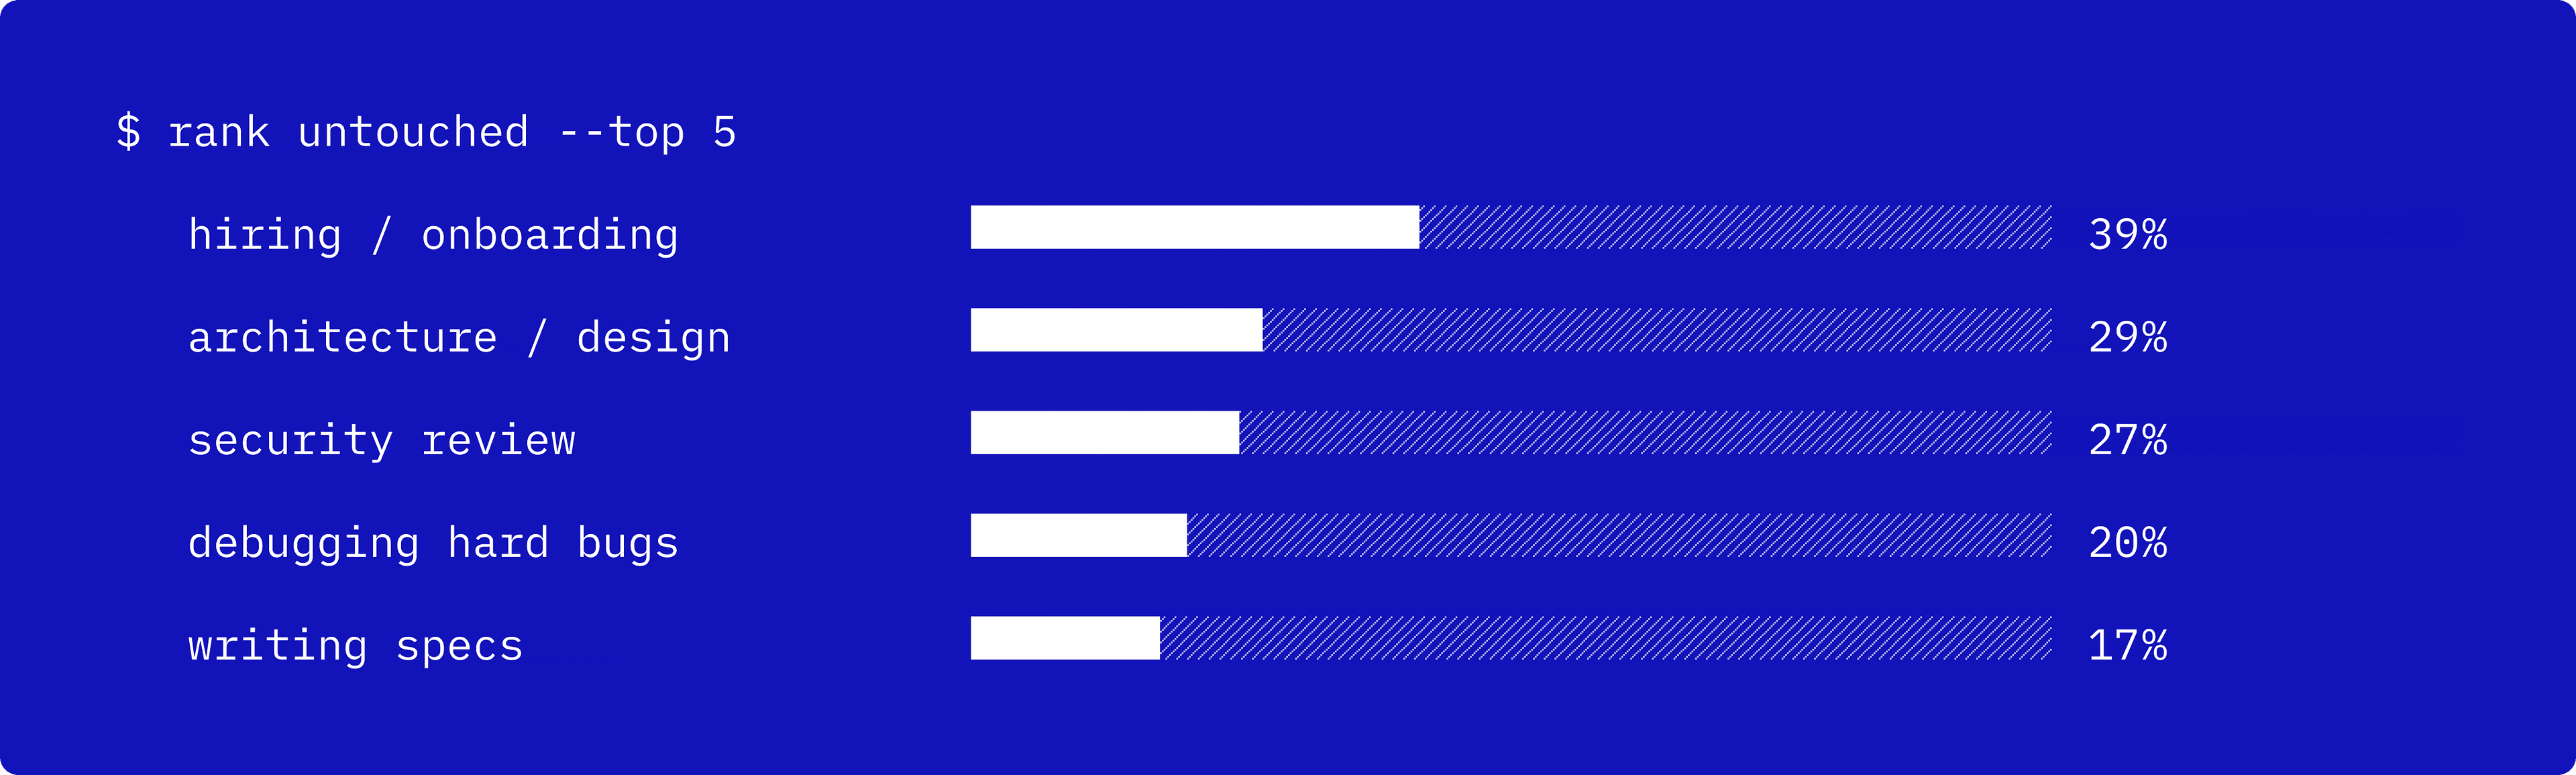
What parts of your job has AI had the least impact on? · select up to 3 · n=810 · separately, 28% said no area was untouched, AI changed nearly everything
Two questions on the same scale: where the field stands today, and where it’s heading in five years. The present, they’re sure about. The future, less so — their forecasts thin into a row of increasingly hedged bets.

Worry isn’t flat across experience. The newest engineers are the most sanguine: the most likely to call it “solved” (36%) and the least likely to fear long-term liabilities (54%). That flips fast: a little time in the field, and the liability worry climbs to 62% before leveling off. A little experience is enough to sober people up; more doesn’t add much.
That’s where they stand today. Asked to look five years out, the same group gets bolder.
Rate each statement · n≈765
[I used to believe] AI-written code should be reviewed every line; now it’s more about reviewing the high-level concepts and a few key parameters.
They’re bullish on AI-driven research and on AGI-as-announced, ambivalent about whether today’s labs and closed models keep their lead, and genuinely split on architecture. They’re more productive today, and expect the ground to keep moving under them.
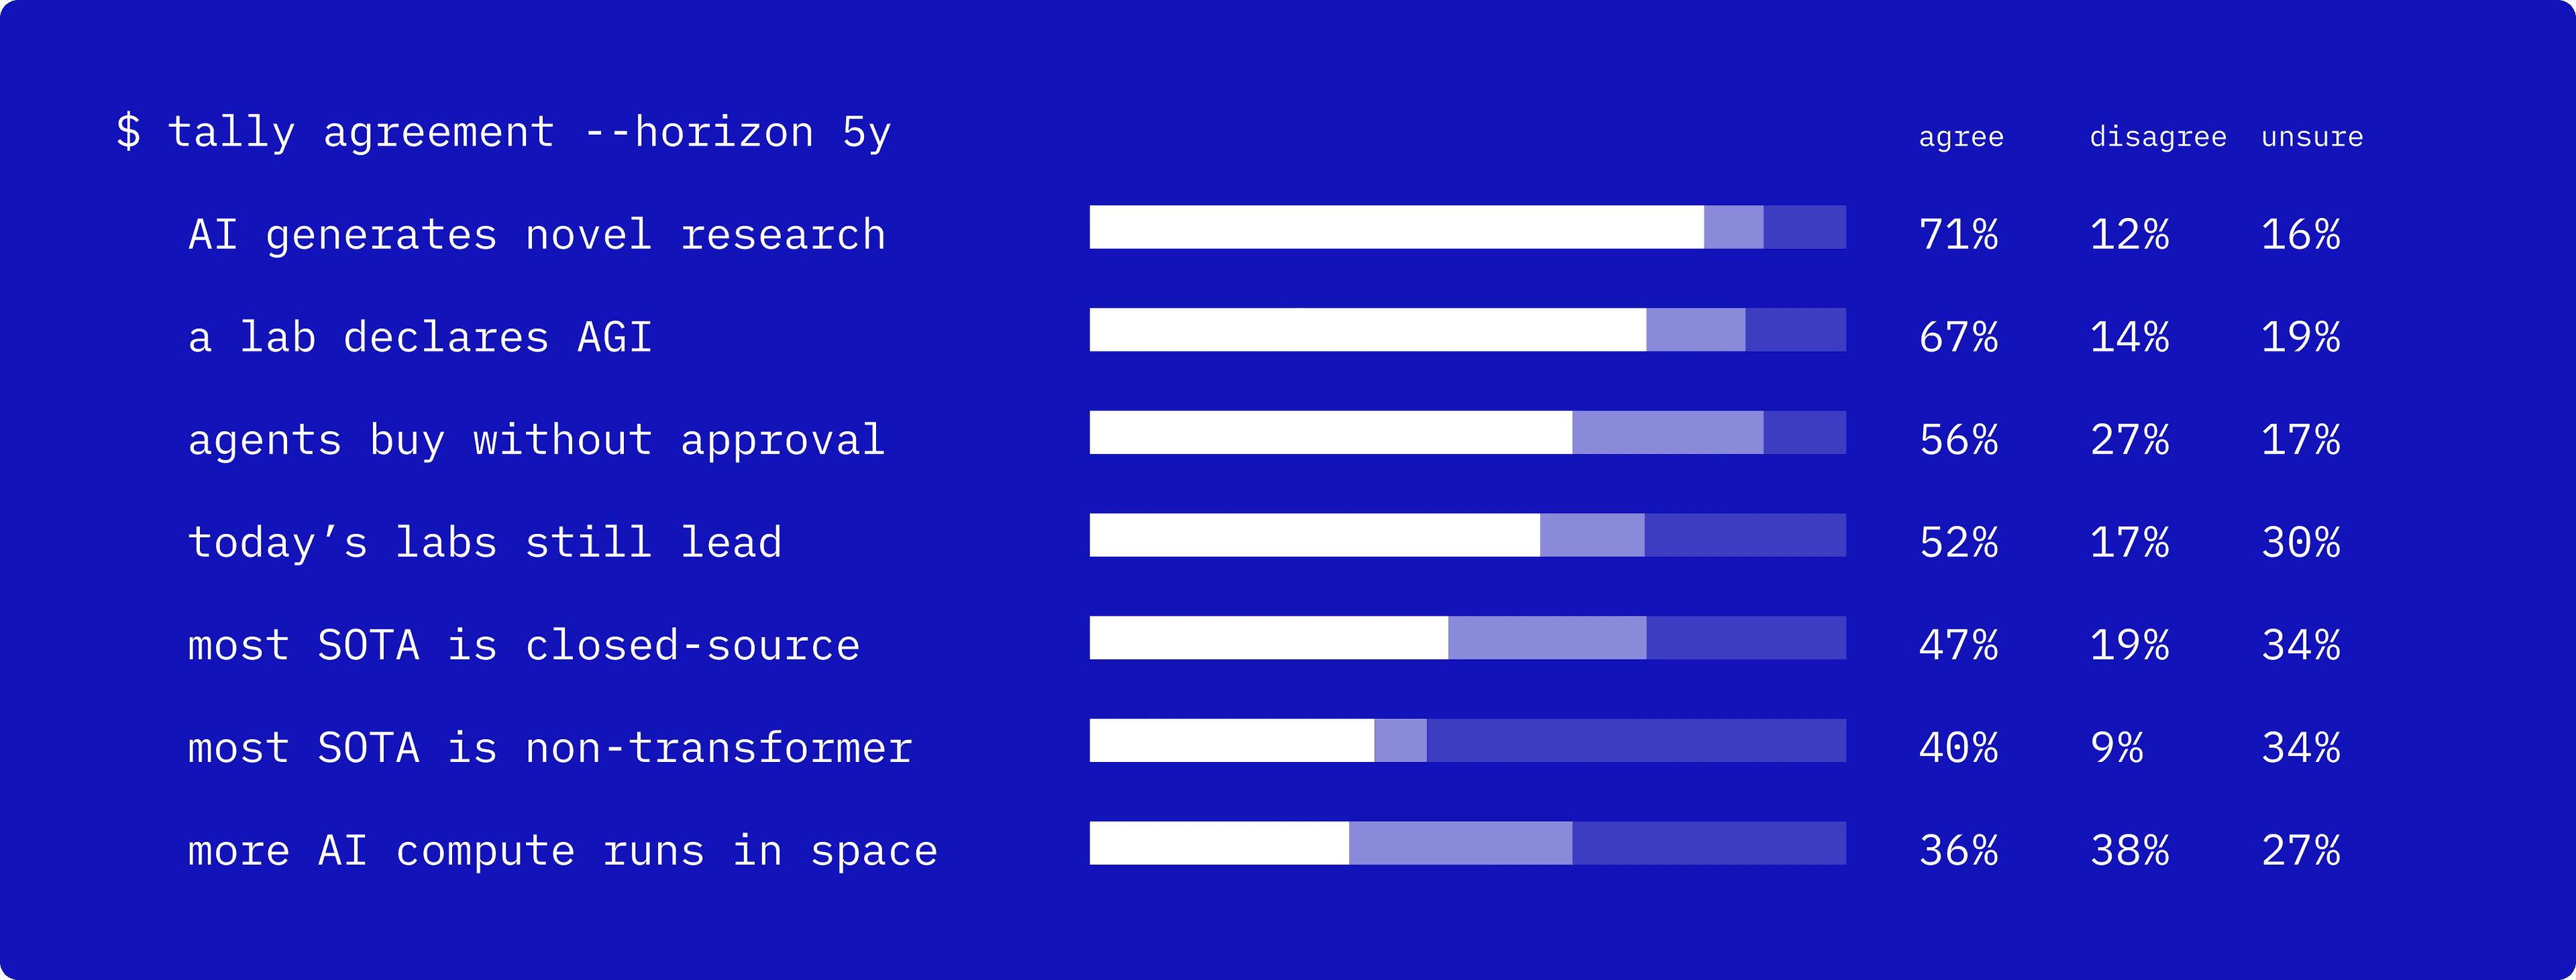
In 5 years… · n≈770
If they expect the ground to keep shifting, they’ve already felt it move. Asked what they once believed about AI engineering and no longer do, their answers land on the tensions this report has traced. So we’ll let them have the last word.

“[I thought] that it would replace me, like everybody thought — but now I see it more like a tool to make my life easier.”
— Fullstack Engineer
“It’s not magic — there’s a way of thinking that cannot be compromised.”
— Founder
“I thought it would make people smarter. Usually it makes their weaknesses louder — the output is just multiplied.”
— Data Scientist
“I used to think great prompts were enough. Now I know robust AI products live or die on evaluation, data, and orchestration — not just model choice.”
— Fullstack Engineer
“That it’s not software engineering — but it turns out it’s just a specialised form of it.”
— AI Engineer
“I used to believe that existing software developers are advantaged, but now I realize the main advantages are creativity, agency, and ambition.”
— AI Engineer
If there’s one through-line, it’s the line that closes the section above: there’s a way of thinking that can’t be compromised.
For builders
The leverage is real, but durability is the discipline that protects it. Treat evaluation as a first-class layer of the stack rather than an afterthought. The teams shipping agents with the most confidence are the ones measuring them most rigorously.
For engineering leaders
The role is converging, and the work AI has changed least is the human-trust work: hiring, architecture, security review. That is where to concentrate senior judgment. And watch skill erosion: the same people reporting the biggest productivity gains name it their top worry.
For tool-makers
The bottleneck users actually feel is reliability and memory, not raw capability: hallucinations and lost context top the failure list. Evaluation is the single hardest, most-wanted part of the stack; whoever makes rigorous eval easy earns the trust that unlocks autonomy.
Methodology
Insights for this report were derived from survey responses collected from 1,053 respondents between May 16 and June 15, 2026.
Multi-select questions report the share of respondents choosing each option, so columns can exceed 100%.
Single-select questions are a share of those who answered, and denominators vary by question (~1,053 at the top, ~770–890 mid-survey, ~640 on open text).
Year-over-year figures compare with the 2025 edition, which was fielded to a different partner audience, so treat those deltas as directional.