Great project management is the difference between hitting deliveries without friction and battling fires as deadlines loom.
Any team benefits from using project management tools to create smooth workflows and keep colleagues on the same page. The best project tracking system for you will be one that’s as agile as your team — but with so many systems available, it’s hard to know what’s best. This is where Gantt charts come in.
Gantt charts are a powerful way to visualize project timelines and streamline resource management. Let’s review how to make a Gantt chart to build an adaptable, flexible system that frees your time for other tasks.

Gantt chart templates to help you plan projects better
Whether it's planning sprints, organizing tasks, or working in Agile, here's a collection of Gantt chart templates you can start using with one click.
What’s a Gantt chart?
A Gantt chart is a project-tracking system that displays tasks and their dependencies as horizontal bars stretching across a timeline. But this stacked bar chart is so much more than a timeline.
As you change one task, you can visualize how those changes affect workloads and disruptions to any tasks depending on it. This helps you keep track of an entire project’s scope and scale based on time, budget, and resource constraints.
Whether you’re creating apps or writing blog posts, Gantt charts are a must-have. The best-laid plans and strategies look great on paper, but changes and unexpected hiccups always appear after starting. This is where Gantt charts really shine.

A Gantt chart provides a bird’s eye view of how each step progresses once a project’s underway.
Are you going to hit certain milestones and deadlines on time? Are you going over budget? Will the project take too long? Do you need to extend a freelancer’s contract or provide maternity cover because a particular sprint now falls during her leave? You can quickly answer these questions and more by peeking at your Gantt chart.
Gantt chart visualizations are also a great way to loop stakeholders in on a project’s progress. They can tweak funding expectations to accommodate timeline adjustments or request additional steps to add value to the project.
5 components of a Gantt chart
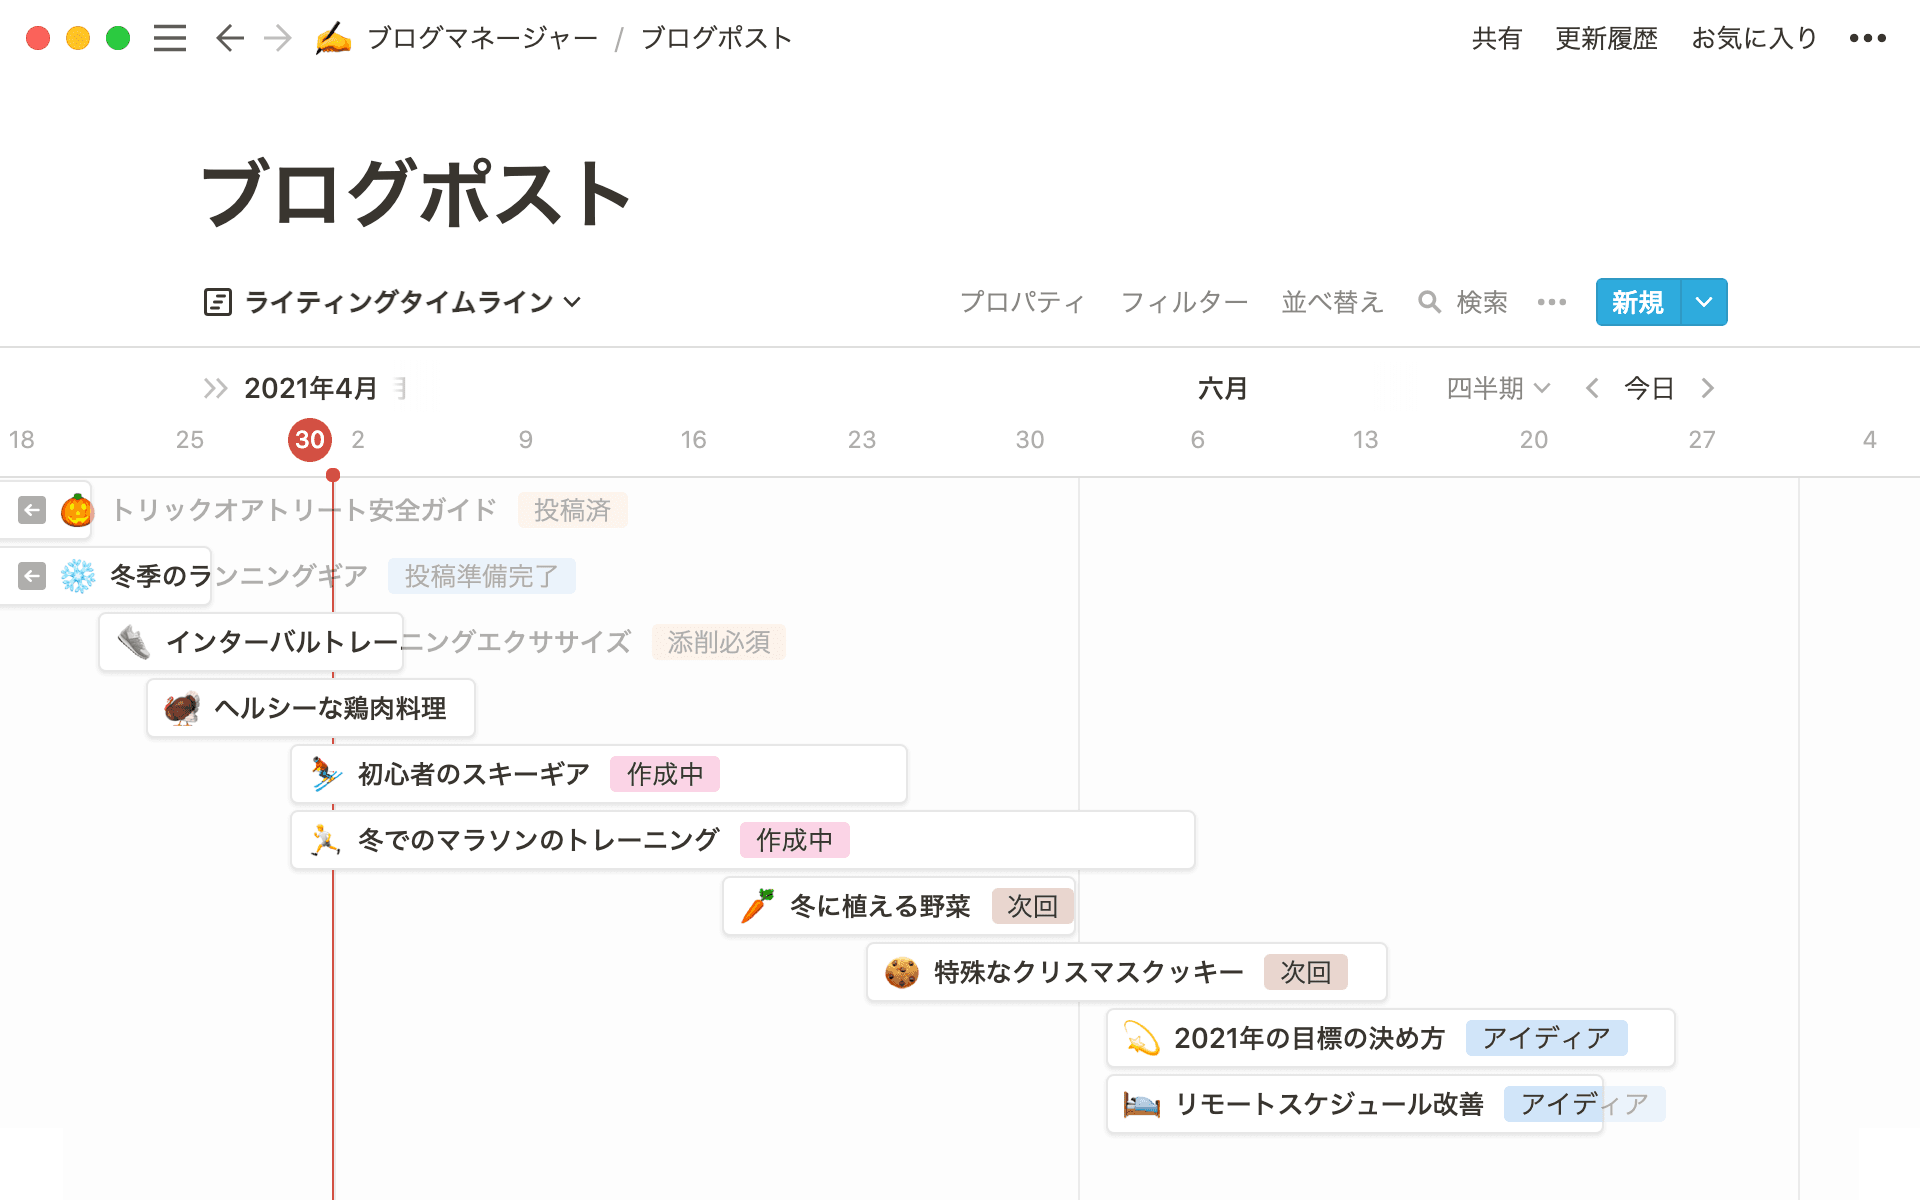
Each Gantt chart component works together to make it a powerful visualization tool. Check out this Gantt chart in your Notion workspace as the timeline view.
Whether you’re making a Gantt chart in Excel or hoping to make a Gantt chart in your iPad’s Pages app, these charts always have the following features:
Timeline — a project’s timeframe will stretch horizontally across the top of a Gantt chart. You can configure it to measure time in hours, days, weeks, months, or years, depending on your project’s needs.
Task list —horizontal bars represent each task, spanning across a time frame and down the page. Most charts give you the ability to break down your project into connected tasks to see how changing one aspect affects another.

Dependencies —denote that a task depends on another with lines connecting the main task to a subtask. When you alter elements of one task, dependent tasks adjust automatically.
Progress — a progress feature shows whether you’re on track for your milestones and deadlines or falling behind. In Notion’s timeline view, the red vertical line represents progress.
Assignee — assign a team member to a task. This helps project managers and team leads keep track of their reportees’ workloads and know who to approach with questions about any aspect of the project.
While you can make Gantt charts on various software, Notion will intuitively track your progress and sync with other databases. Your team can turn any workflow into a Gantt chart by adding the “Timeline” view to a database.
The pros and cons of Gantt charts
Gantt charts are a powerful project management tool, but they’re not without their flaws. Here are a few pros and cons to help you decide if this is the project display for you.
Advantages
See everything, everywhere, all at once — you can’t manage or track what you can’t see. Gantt charts enable project managers, team leads, and stakeholders to review an entire project from start to finish.
Roll with the punches — plans grow with projects. With flexible charts, you don’t need to throw strategy out the door with the first major changes. Instead you can create dependencies between tasks in your project to track speed bumps and updates.
Make accurate time estimates regardless of how often your project changes — Gantt charts provide precise time estimates at any given point in the project. Use these to gauge whether you’re on track for hitting specific milestones or need to reconsider your project plan to ensure you stay ahead of deadlines or under budget.
Disadvantages
Hard initial learning curve — reading Gantt charts isn’t necessarily intuitive. And if your chart isn’t well-organized, it may be extra hard to understand.
Tricky to update — you’ll need to teach team members and stakeholders to update the Gantt chart to avoid creating bottlenecks in your workflow. Everyone involved should know how to manage the chart.
Easy to make unintended changes — Gantt charts shine at visualizing task dependencies. But this also means that making a mistake when updating a Gantt chart can create unintended effects on dependent tasks.
How to make a Gantt chart
There are several online tools for making Gantt charts, and whether you’re making Gantt charts in Word, Excel, or Google Sheets, the basic premise is the same. But we think ours is easier because you can easily learn how to set up the timeline view for a database.
If you don’t want to create a timeline view from scratch, check out our Gantt chart templates for creating project charters, managing project schedules, and planning sprints.
To build your own timeline view, follow these steps:
1. Start with a database
The timeline database view displays a classic Gantt chart, so the first step is creating a page with a new database.
Before you use the timeline view, make sure the tasks or events within your database have the following properties:
Date — add a Date property to your page to create the horizontal time axis we’ll see in the timeline view. It’s not possible to make a Gantt chart without dates, so if you haven’t confirmed project dates, set estimates.
End date — add an End date to dates to create ranges and take advantage of the timeline view’s time-mapping capabilities.
Name — stay organized by using a column to name each task or event. In the example below, we’ve named the first event “Departing flights.”
Assign — in Notion, you can tag team members directly in their required tasks.
It might be helpful to set this information up in a table with the necessary columns to keep everything organized, like the schedule below.
2. Add a timeline view
Type /timeline view to add a timeline view. Once you connect your database, all associated elements with dates should display on the timeline view.
You can also add this view to an existing page by clicking the Plus on the top left side of a page, beside the other views, like Tables and Calendars.
3. Customize the timeline view
Notion’s timeline view does much more than a traditional Gantt chart. You can:
Use the Filter option to customize what shows up on your timeline by tags, dates, task names, and more.
Determine what properties this view displays by clicking the ... and selecting Properties. The eye will help you choose what’s visible on the timeline, should you want assignees or descriptions to be visible.
View tasks by finish date, start date, and more. Click on the ... and select Layout. Use the Show timeline by option to customize your view.
Bonus tips for creating a Gantt chart
While each Gantt chart is different, here are some things to keep in mind:
Be detailed with task specifications because ambiguous details and assignments may cause misunderstandings and delays.
Divide your project into several tasks and group these tasks as needed to avoid creating overwhelming steps. Subdividing projects helps timelines seem more manageable.
Assign team members to each task to make your project run smoothly.
Connect subtasks to create a web of to-do items.
Use the tools that work best for you
Gantt charts are one of the best project management tools to organize multiple timelines at once. Other project tracking tools simplify various stages of the project lifecycle, such as displaying dependencies or highlighting staffing needs. Play with Notion’s database views to figure out your preferred way of visualizing, tracking, and organizing projects.
When in doubt, work with a guideline. We’ve created easy-to-use templates for planning, budgeting, product management, and more to help you stay organized—with minimal friction.

